
Figure 3.
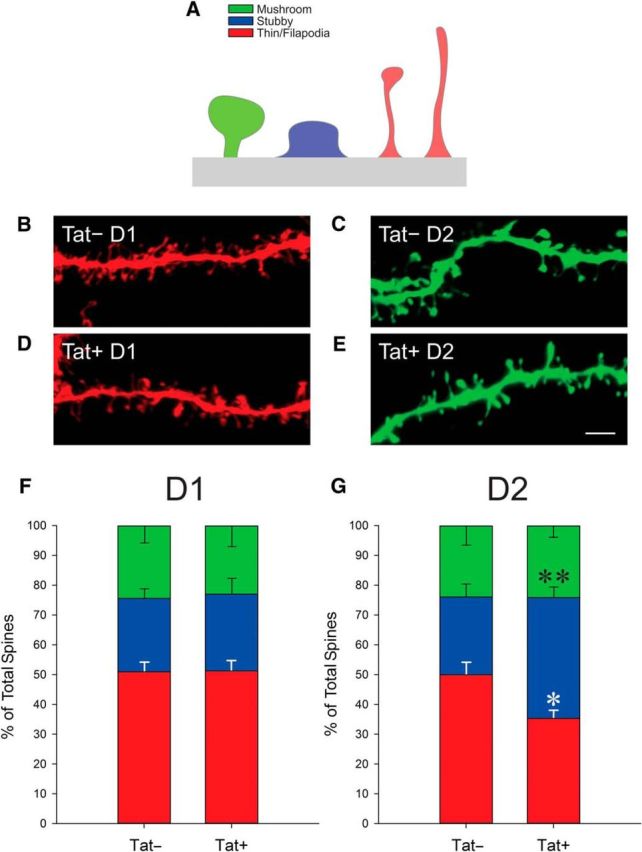
A, Depiction of the three classifications of dendritic spines assessed in this study. B–E, Representative dendrite segments from Tat− (B) and Tat+ (D) D1 MSNs and from Tat− (C) and Tat+ (E) D2 MSNs showing various dendritic spine morphologies. Scale bar, 3 μm. F, G, Percentage of morphologic spine types on D1 MSN dendrites was unchanged between Tat+ and Tat− animals (F), whereas the percentage of filopodia/thin-shaped spines on D2 MSN dendrites was decreased in Tat+ animals (*p < 0.05), the percentage of stubby spines increased (**p < 0.05), and the proportion of mushroom-shaped spines was unchanged compared with Tat− controls (G).