FIG. 1.
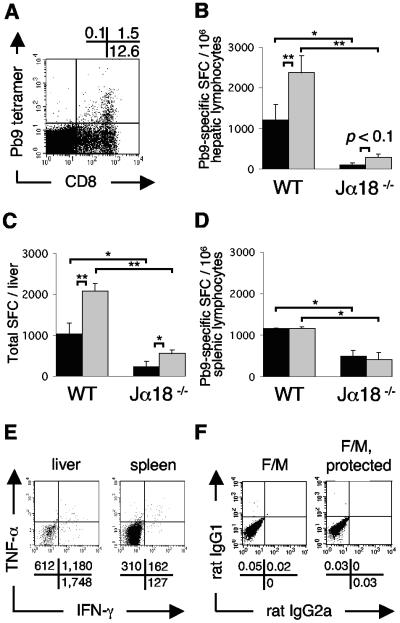
Prime-boost vaccination with FP9PbCSP/MVAPbCSP (F/M) induces peptide Pb9-specific IFN-γ-/TNF-α-producing CD8+ T cells, promoted by Vα14iNKT cells. (A) Representative Pb9 tetramer+/CD8+-T-cell population (gated first on lymphocytes and then on TCRβ+ cells) in the liver 14 days after intradermal vaccination of BALB/c mice. The percentages of positive cells in each quadrant are displayed above FACS analysis profiles. (B to D) IFN-γ-producing (▪) and TNF-α-producing (░⃞) peptide Pb9-specific CD8+ T cells in the livers (B and C) and spleens (D) of BALB/c WT mice in comparison with Vα14iNKT-cell-deficient Jα18−/− BALB/c mice (n = 4/group). SFC/million lymphocytes (B and D) and total SFC per liver (C) were detected by IFN-γ and TNF-α ELISPOT assays 20 days after F/M vaccination. Means ± the standard error of the mean (SEM) are shown; the statistical significance was determined by using the Student t test (**, P < 0.01; *, P < 0.05). The results of one representative experiment out of two performed are shown. (E) ICS of CD8+/CD3+ Pb9-stimulated pooled (n = 2) hepatic lymphocytes and splenocytes from WT mice 40 days after vaccination. The absolute numbers of positive cells per million lymphocytes are shown for the respective quadrants, as calculated from the events (gated on CD8+/CD3+) for the absolute numbers of CD8+ T cells in one million lymphocytes (according gated percentages of CD8+ T cells from all lymphocytes) are given below the FACS analysis profiles. (F) ICS isotype control dot plots for IFN-γ/TNF-α (rat IgG2a) and CD8 (rat IgG1) from hepatic MNC from pooled WT mice 25 days after F/M vaccination (n = 2) and for protected vaccinated WT mice (see Fig. 5D) 9 days after sporozoite challenge, at 40 days postvaccination (n = 2). The percentages of positive cells are shown for the respective quadrants.

