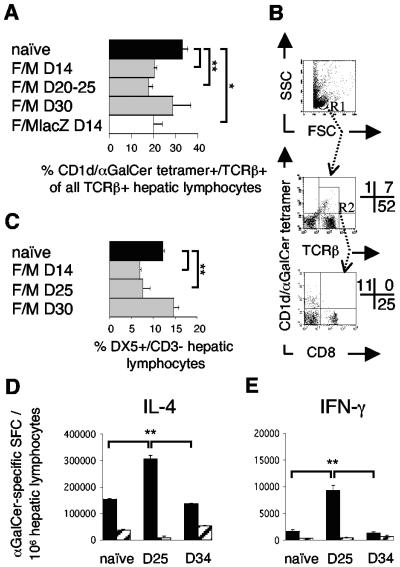
FIG. 2.
Systemic activation of Vα14iNKT and NK cells in the livers of BALB/c mice by intradermal F/M vaccination. (A) Hepatic CD1d/α-GalCer tetramer+/TCRβ+ Vα14iNKT cell frequencies (gated as shown in panel B) by FACS analysis 14 days (D14) to 30 days after vaccination with the malaria vaccines or with empty control viruses (FP9lacZ/MVAlacZ). Pooled data from eight experiments, each including naive mice (n = 3 to 4/group) are presented. (B) Representative FACS dot plots of Vα14iNKT cells on day 25 after F/M vaccination from panel A, with the percentages of positive cells displayed in quadrants. Gating first on lymphocytes (R1, upper dot plot) yielded CD1d/α-GalCer tetramer+/TCRβ+ cells (Vα14iNKT cells) in the upper right quadrant (middle dot plot). Vα14iNKT cell frequencies in panel A are calculated as a percentage of these double tetramer+/TCRβ+ cells from the sum of all TCRβ+ cells (upper and lower right quadrant, middle dot plot). A second gating on all TCRβ+ cells (R2, middle dot plot) demonstrates tetramer+ cells to be CD8− (lower dot plot). (C) Hepatic NK cell frequencies before and after vaccination as in panel A, as determined by FACS analysis. (D and E) Hepatic (▪) and splenic (░⃞) ex vivo IL-4 (D) and IFN-γ (E) Vα14iNKT-cell responses to α-GalCer, as measured by ELISPOT assay, from naive mice and mice 25 and 34 days after F/M vaccination (n = 4/group). The results from one representative experiment out of two performed are shown. Results are means ± the SEM; statistical analysis was done as described for Fig. 1.

