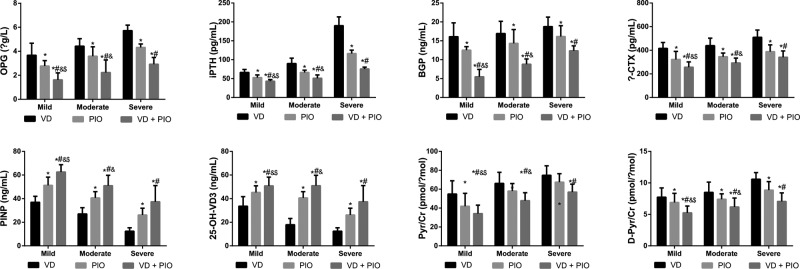
Figure 2. Comparisons of bone metabolism parameters of patients with T2DN among three groups.
Note: *P<0.05 compared with the VD group; #P<0.05 compared with the PIO group; &P<0.05 compared with the severe group; $P<0.05 compared with the moderate group; VD + PIO, vitamin D plus pioglitazone hydrochloride.

