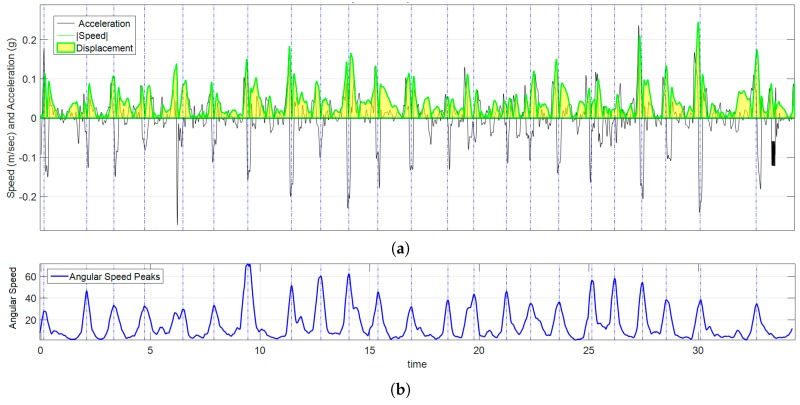
Figure 10.
Graph of kinematic spatial parameters for volunteer 12 while playing exercise 3. (a) Black signal is the magnitude of the acceleration, the absolute value of velocity is drawn in green, and the area under the curve (in clear yellow) is ; (b) corresponds to the peak detection of , each pair of peaks were used to set the appropriate time interval for numerical calculations.

