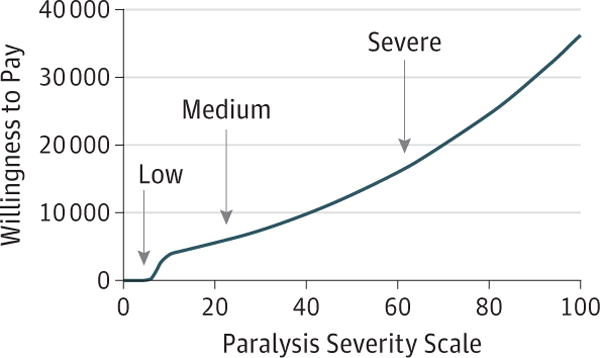
Figure 2. Willingness to Pay (WTP) vs Paralysis Severity Scale.

Graph represents the mean WTP to repair facial paralysis by increasing perceived severity scores. Mean perceived severity scores of reposed faces with low-, medium-, and high-grade paralysis are marked accordingly on the scale (low-grade paralysis, 3.92; medium-grade paralysis, 23.32; and high-grade paralysis, 60.95).
