Fig. 4.
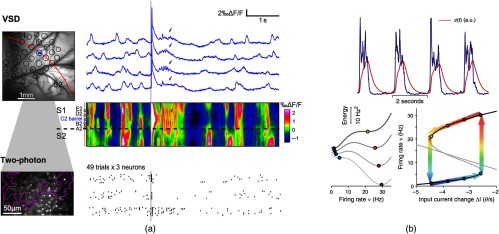
Brain dynamics after a sensory input: (a) spontaneous dynamics, response evoked by a brief somatosensory stimulation and poststimulation dynamics, recorded in anesthetized rat barrel cortex using both VSD imaging of population activity and two-photon microscopy of individual neurons spiking activity. VSD signals display four example trials and are extracted from the stimulated barrel location (blue circle in the barrel map on the left); in addition, a spatiotemporal display allows visualizing activity throughout a line (marked in red in the barrel map) crossing both the primary and secondary somatosensory cortices (S1 and S2). Raster plot of spikes extracted from the two-photon recordings displays 49 trials for three different neurons. The main effect of the sensory input on the subsequent dynamics is a decrease or even interruption of the up states appearances for a few seconds (see text for more details). Adapted from Ref. 68 with permission. (b) A model of up and down states generation that involves a fatigue mechanism. (top) Example multiunit activity trace from experiment (blue) and reconstructed fatigue variable . (bottom left): energy landscapes for different levels of activity-dependent adaptation/fatigue; when fatigue is high (top trace), the minimum energy point is an absence of activity. (bottom right): stable (solid branches) and unstable (dotted branch) asymptotic states of firing rate at different fatigue levels here represented as effective changes in the input current to the neurons in the network; colored arrows and circles depict the orbit in the phase plane followed by the network under the relaxation oscillator regime. Adapted from Ref. 69 with permission.

