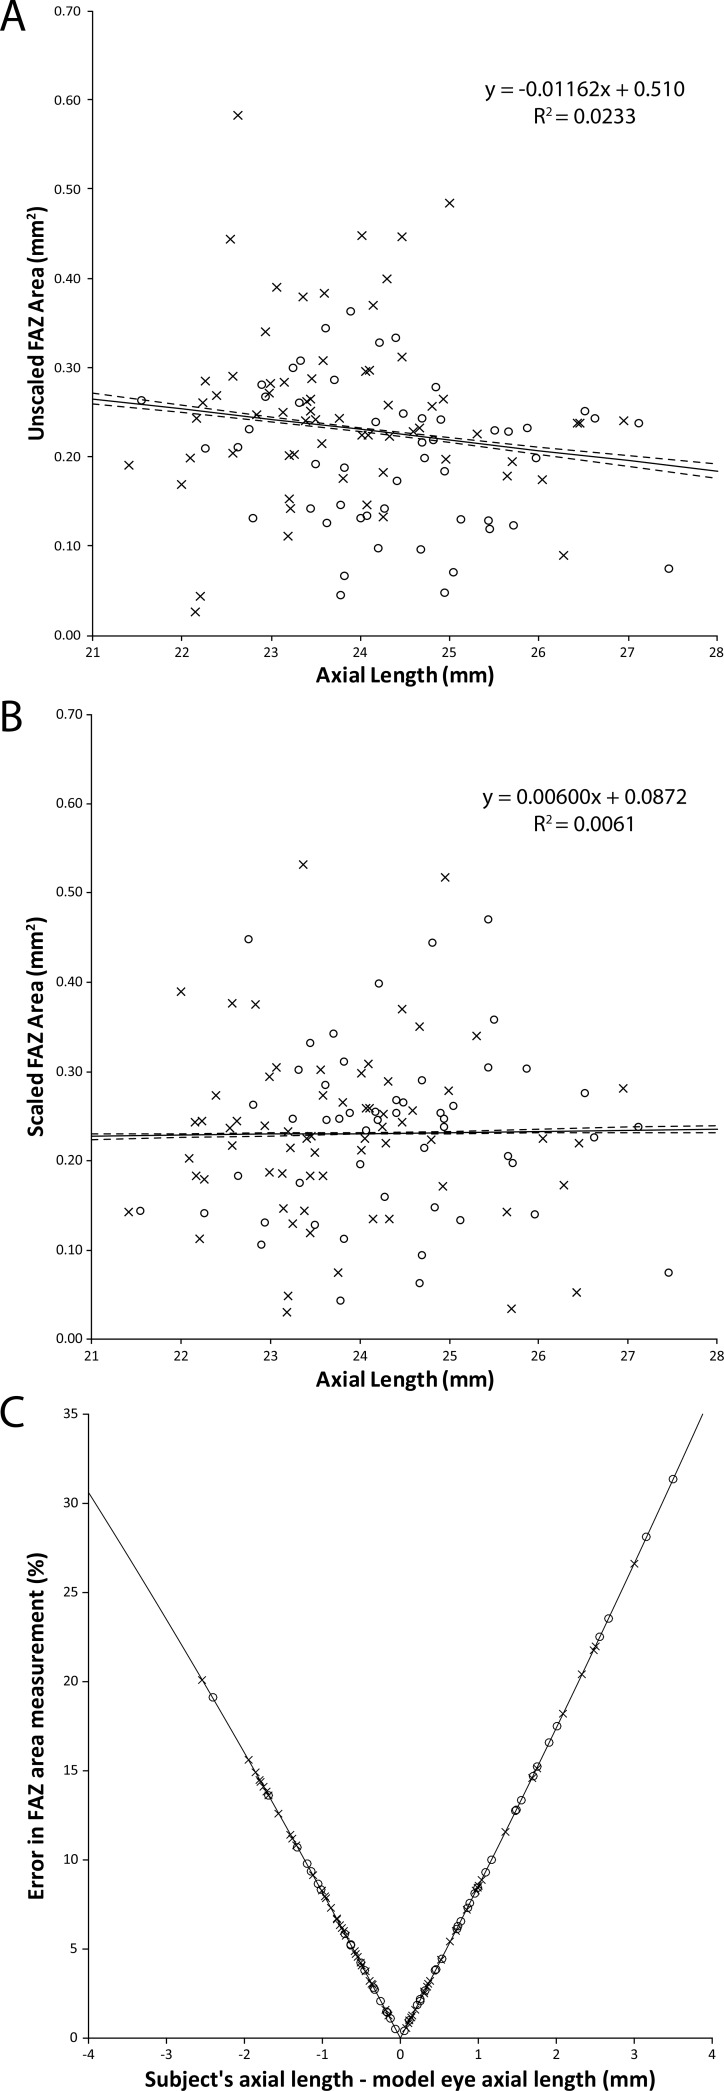
Figure 1.
The effect of axial length on semiautomatic FAZ area measurements. (A) FAZ area assuming a nominal 3 × 3 mm scan area. There is a slight negative trend as axial length increases (solid line is trendline, dashed lines are 95% confidence intervals), though not significant (P = 0.10). (B) FAZ area when accounting for axial length. The downward trend disappears when axial length is considered (P = 0.87). (C) The error in FAZ area measurement resulting from a failure to account for axial length. As the deviation in axial length increases, so does the error in the FAZ area. (Error model, E = [1 − (ALS/ALM)2] ∗ 100%; solid line.) Data plotted separately for males (open circles) and females (crosses).

