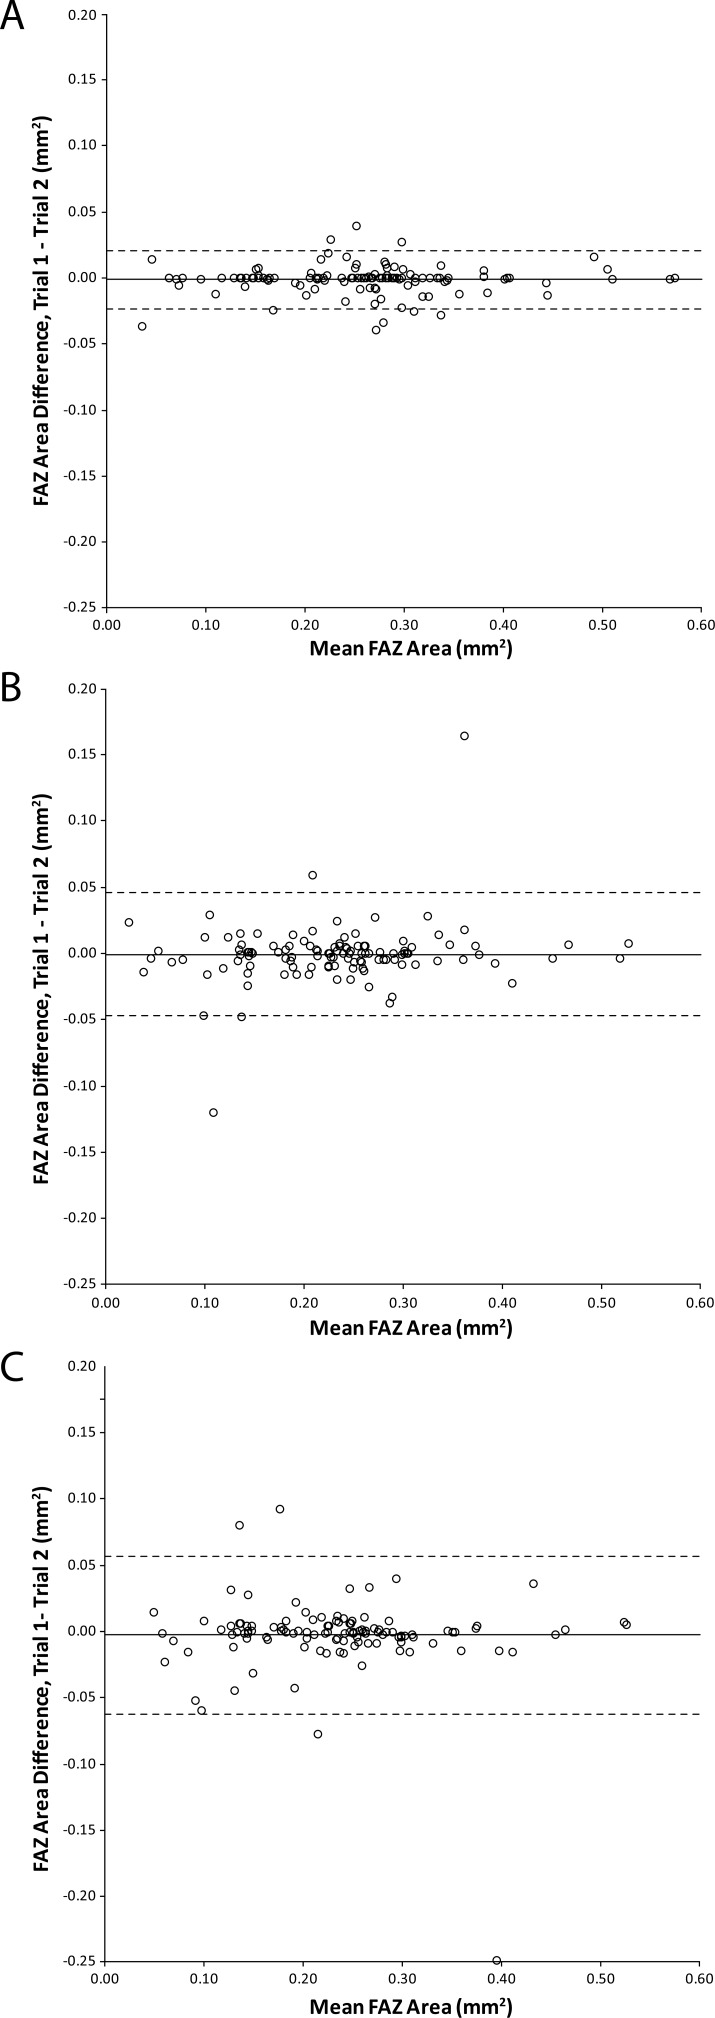
Figure 2.
Effect of segmentation method on intrasession repeatability. Data are expressed in Bland-Altman plots to show the repeatability of FAZ area measurements using either (A) manual segmentation, (B) semiautomatic segmentation software (version 2016.2.0.16), or (C) automatic segmentation software (version 2016.200.0.37). Solid lines represent the average difference between the two trials, while dashed lines represent 95% confidence intervals.

