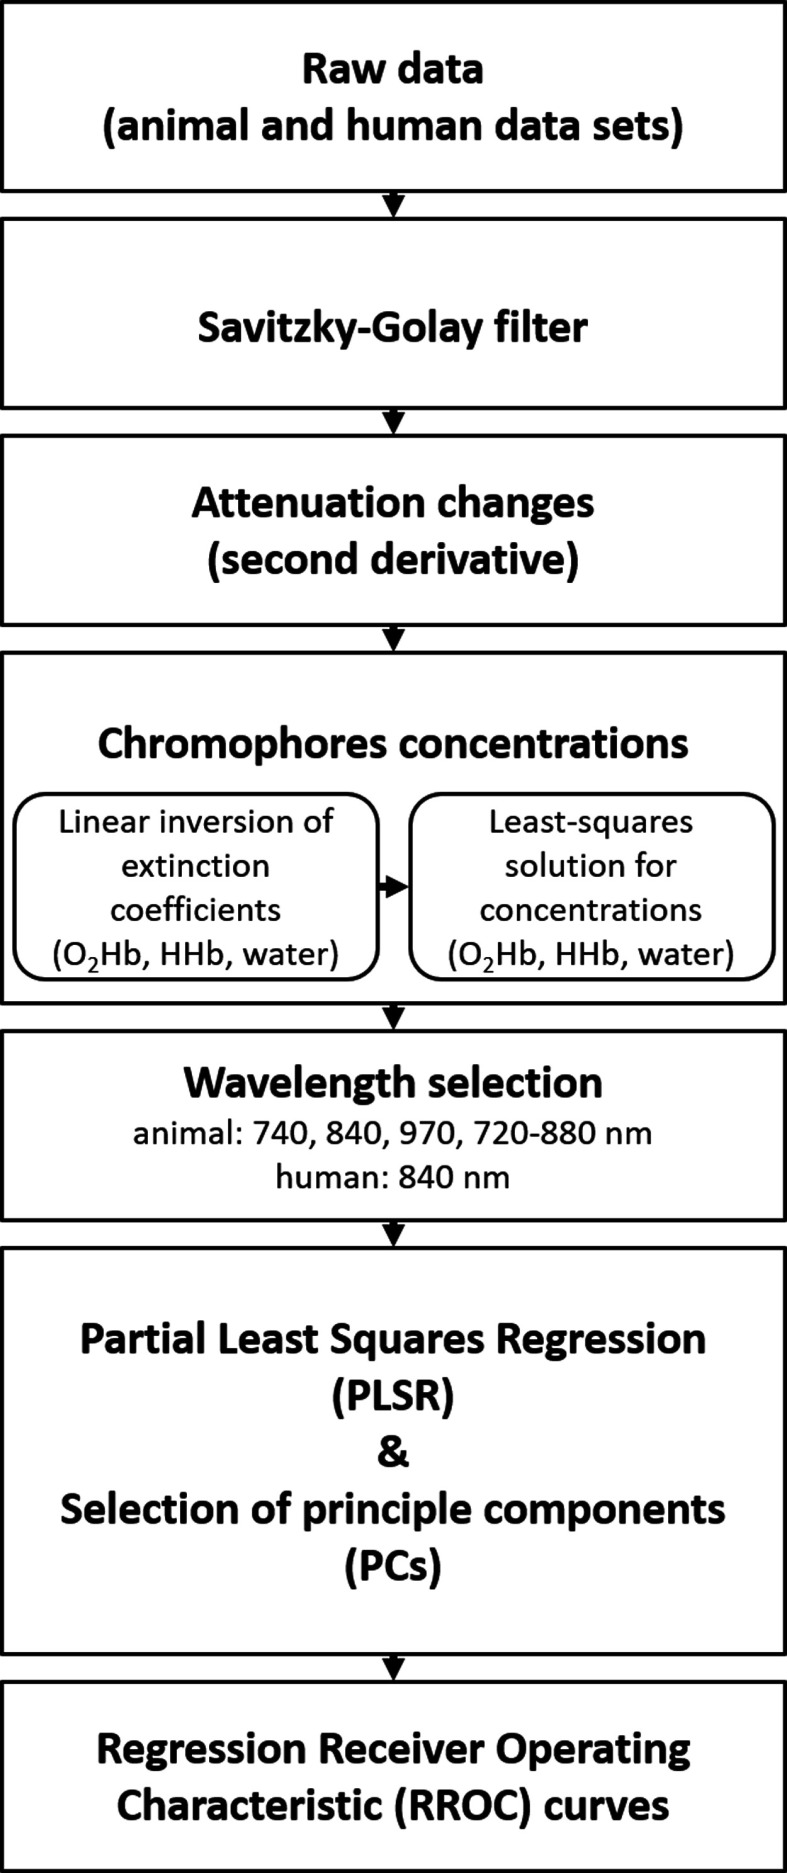
Fig. 3.
Flow chart of data analysis procedures. Raw data were smoothed using a Savitzky–Golay filter, followed by the illustration of the attenuation changes (Sec. 3.1). We then proceeded to the calculation of the chromophores concentration (Sec. 3.2), including the wavelength selection (Sec. 3.3). Subsequently, the PLSR was applied for temperature prediction, including the selection of PCs (Sec. 3.4, Fig. 4). Last, RROC curves were used to illustrate the calibration of the PLSR (Sec. 3.5). See text for further details.

