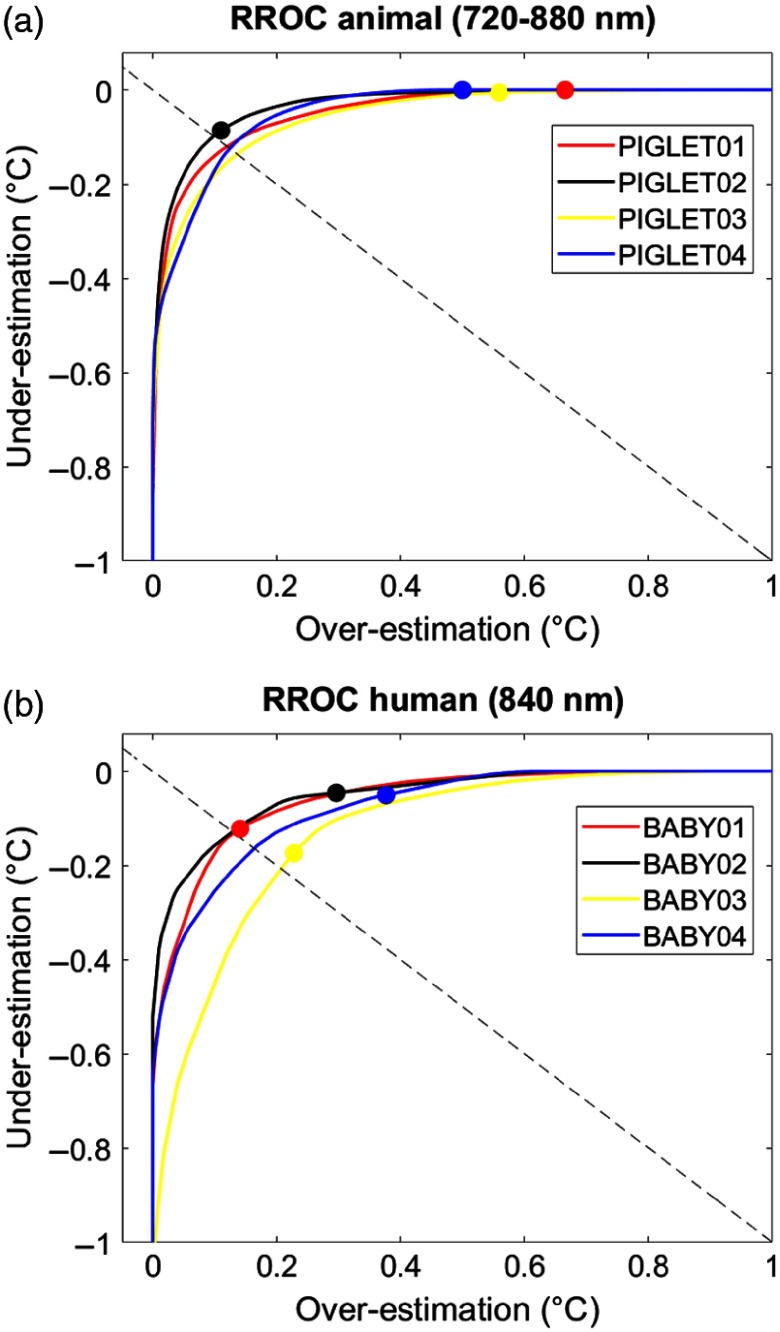
Fig. 7.
Temperature RROC. RROC curves for each single subject of the animal dataset (wavelength interval 720 to 880 nm with three PCs) and the human dataset (wavelength 840 nm with three PCs). Colored points indicate the MEB per subject that represent over- and underestimation relative to the diagonal (dashed line). See Tables 5 and 6 for statistics.

