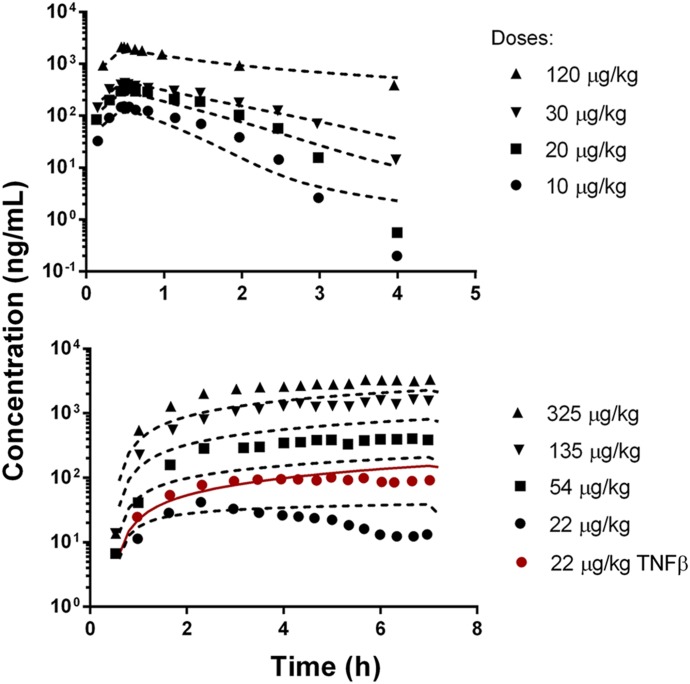
Fig. 4.
Allometric-scaled plasma rhTNF-α concentration versus time profiles in monkeys. Symbols are observed concentrations from literature reported studies (Greischel and Zahn, 1989) and lines depict interspecies predictions using the parameters listed in Tables 3 and 4.

