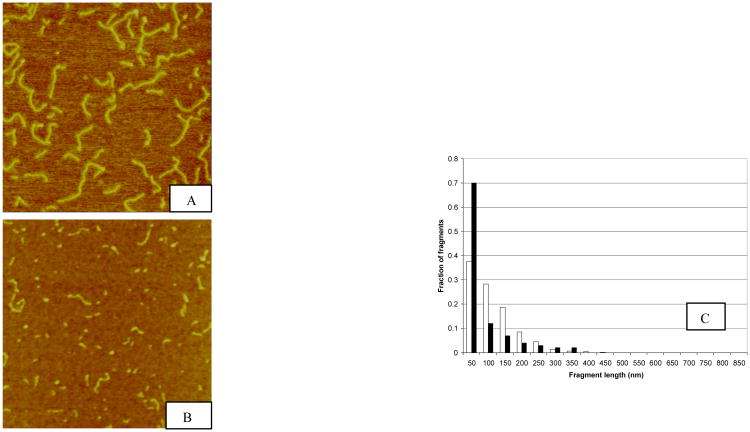
Fig.1.
Sample AFM images of pUC19 DNA irradiated to 10 kGy Co-60 γ-photon (Panel A) and 390 MeV/nucleon Argon ion (Panel B) and the corresponding fragment size distributions (Panel C). The fragment size distributions were obtained by measuring the length of each fragment and group them into bins of 50-nm interval. The number of fragments in each bin was divided by the total number of fragments to yield the fractional number of fragments. 850 nm is the length of an intact pUC19 plasmid DNA molecule. In Panel C the black bars represent DNA fragment length distribution resulting from argon ion irradiation whereas white bars for Co-60 γ photon irradiation. Evident in this graph is the pronounced fraction of short DNA fragments generated by the high-LET Argon ions in the 50-nm bin.

