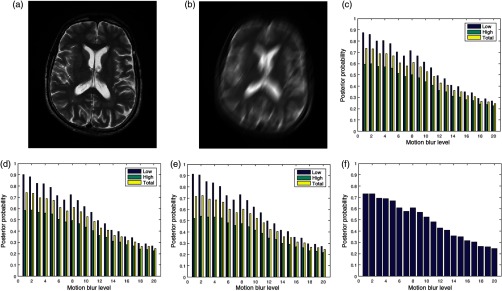
Fig. 6.
(a) A slice in a T2 MRI volume data from BrainCare Oy is artificially degraded by motion blur. The degradation was scaled from 0 to 20. (b) Degraded version of the image corresponding to motion blur level of 20. (c) The contrast attribute quality scores, (d) standard deviation attribute quality scores, (e) sharpness attribute quality scores, and (f) global quality scores for the different levels of motion blur.

