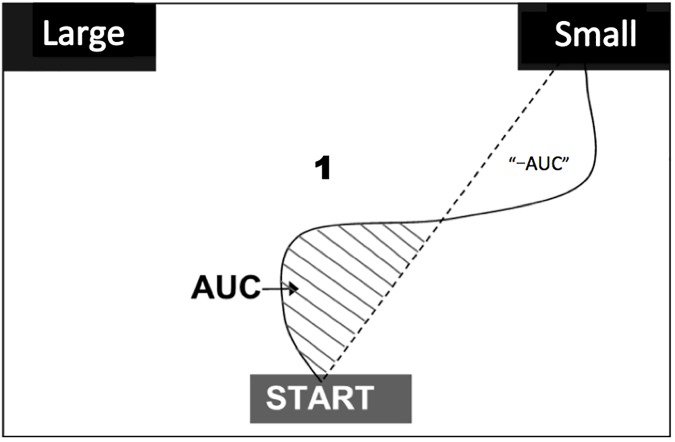
Fig 1. Illustration of the area under the curve (AUC).
In this example, participants judge whether the number “1” presented at the center of the screen is larger or smaller than five. The curve in the figure represents a trajectory of the cursor from the onset position (“START” button) to the ending position (“Small” button). The dashed straight line represents the “ideal path”. The AUC (measured by the number of pixels) is the shaded area circumscribed by the ideal path and the actual trajectory that exceeds the ideal path toward the unselected option (shaded area). Any area exceeds the idea path toward the selected option will be subtracted as “minus AUC”.

