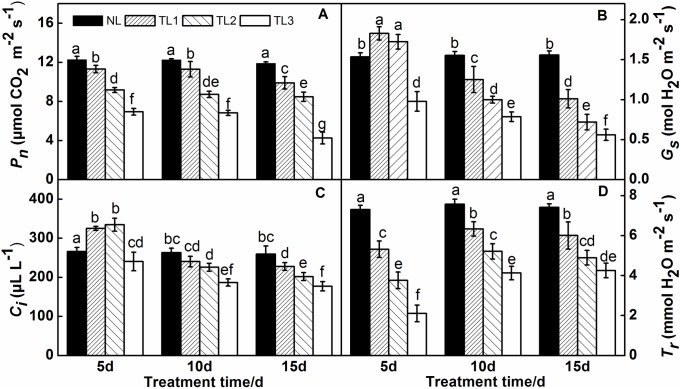
Fig 3.
Effects of low light treatment on photosynthetic rate (Pn) (A), stomatal conductance (Gs) (B), intercellular CO2 concentration (Ci) (C), and transpiration rate (Tr) (D) of purple pak-choi seedlings. The data are the mean of three replicates, with SDs shown as vertical bars. The means marked with different letters indicate significant differences between treatments at p<0.05, as determined with Duncan’s multiple range test. Different lower-case letters at each time point indicate significant differences between treatments.

