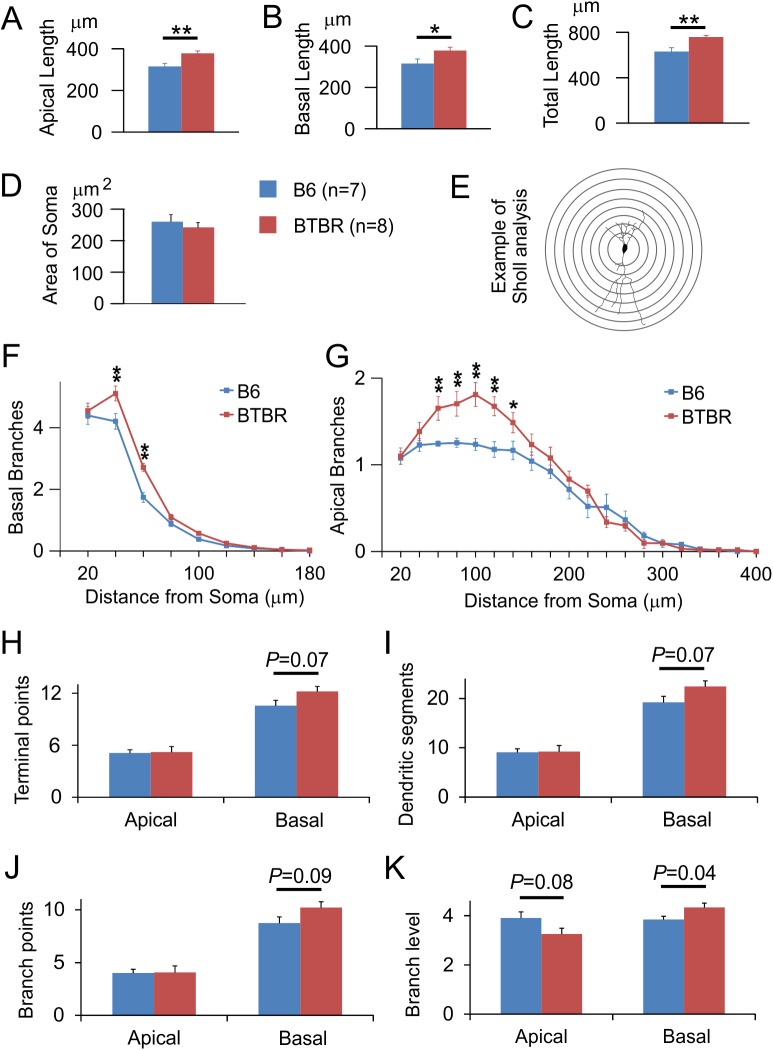
Fig 2. Neonatal BTBR animals had significantly greater dendritic lengths of both apical and basal arbors, and more branching complexity of basal dendrites, compared to the B6 mice.
Bar graphs quantifying the length of (A) apical dendrites, (B) basal dendrites, and (C) total dendritic arbor in CA1 pyramidal neurons in B6 versus BTBR animals. Data were collected from 115 cells of seven B6 mice, and 96 cells of eight BTBR mice. Cross-sectional area of the soma was quantified in (D). n = 7 animals for B6 and 8 animals for BTBR. *: P < 0.05, **: P < 0.01 by Student's t test. (E) Sholl analysis measures the number of intersections between a series of concentric circles centered at the soma and the dendritic arbor of a neuron. Line graphs showing the number of (F) basal and (G) apical dendritic branches at 20 μm intervals away from the soma in B6 versus BTBR animals. For both basal and apical dendritic tree, P < 0.05 comparing B6 vs. BTBR, using two way repeated measure ANOVA. *: P < 0.05, **: P < 0.001 by Holm-Sidak pairwise comparison. The following parameters of both apical and basal dendritic arbor were further compared between the two strains: (H) terminal points, (I) dendritic segments, (J) branch points, and (K) branch level. P values were from Student's t test.

