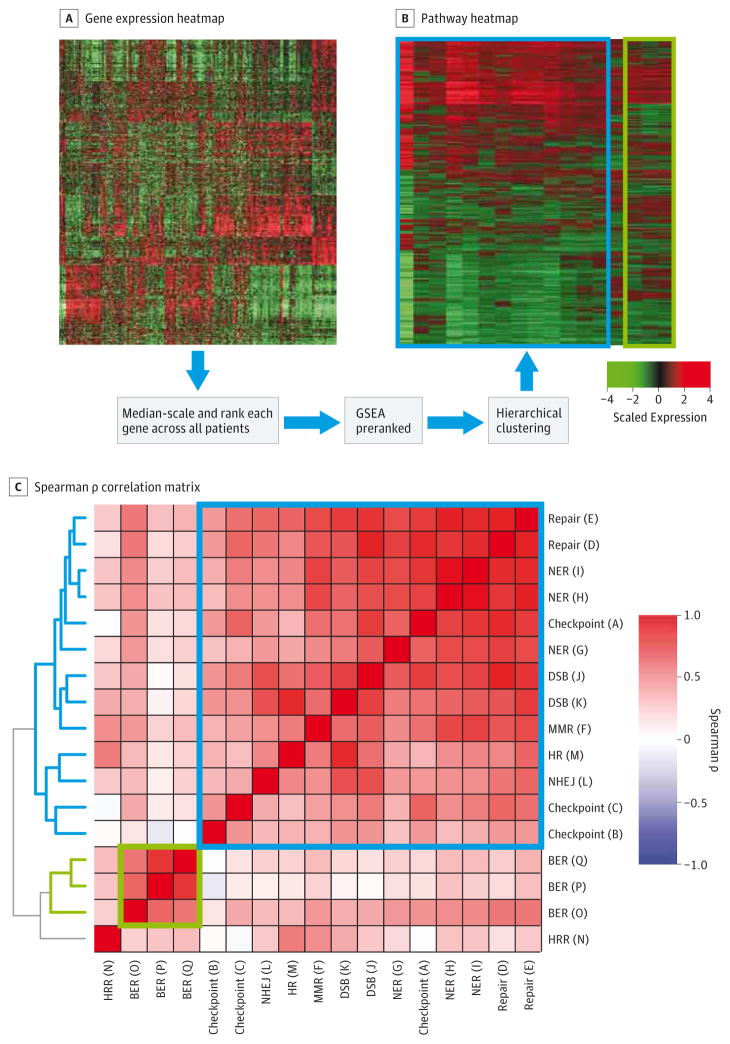
Figure 1. DDR Pathway Profiling Procedure.
A, Microarray gene expression data is converted into (B) pathway enrichment data. Expression is median-scaled and ranked across all samples gene-by-gene. B, Gene Set Enrichment Analysis preranked on gene ranks generates pathway enrichment NES, and hierarchical clustering generates a pathway heatmap. C, Spearman ρ correlation matrix of intercorrelation among the pathways across all samples. BCR indicates biochemical recurrence; BER, base excision repair; DDR, DNA damage and repair; DSB, double-strand break; GSEA, Gene Set Enrichment Analysis; HRR, homologous recombination repair; MMR, mismatch repair; NER, nucleotide excision repair; NES, Normalized Enrichment Score; NHEJ, nonhomologous end joining.

