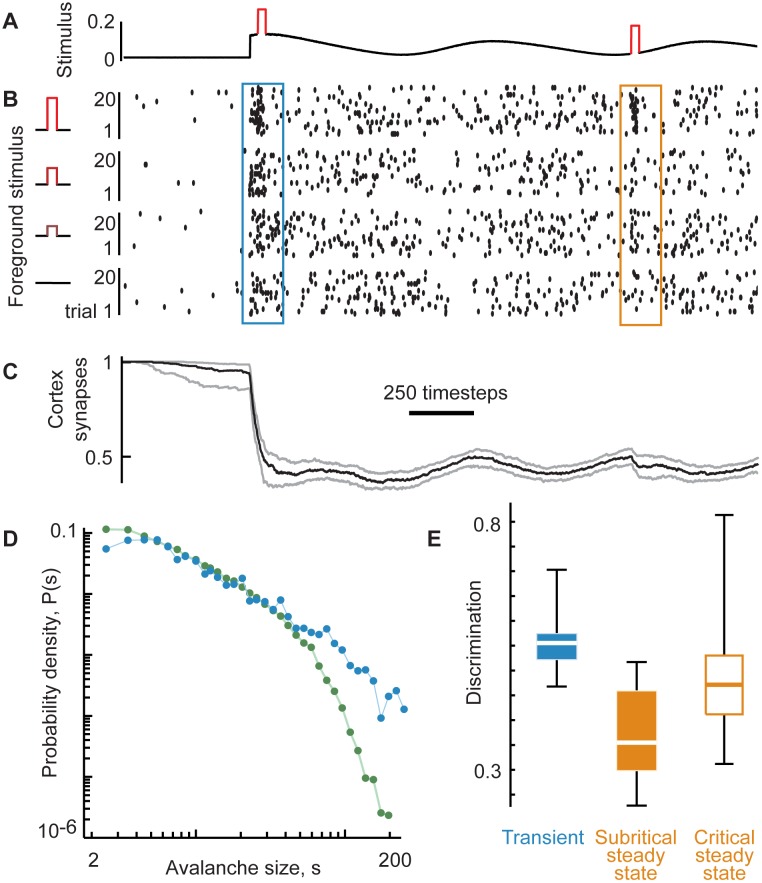
Fig 7. Extreme synaptic depression results in small-scale dynamics and decreased discrimination.
(A) Shown are results from our model with more extreme depression with τd decreased by a factor of 100 compared to the model results in Fig 6. All other model parameters including the stimulus paradigm are unchanged. (B) Subsampled spike rasters for 20 trials for each of 4 different foreground stimulus levels. Note that the steady state spike rate is lower than that in the model results of Fig 6. Spike response does not vary strongly with changing foreground during the steady state. (C) The extreme depression implemented here results in about 50% reduction in cortex synapse strengths. This is a large reduction compared to the ~10% reduction for the model results in Fig 6. (D) During the baseline period (same definition as shown in Fig 6), avalanche sizes are not distributed according to a power-law (green), indicating that the dynamics are not at criticality. Rather, the curvature of the distribution and the lack of large avalanches are consistent with subcritical dynamics. In contrast, the avalanche size distribution during the transient is close to a power-law because the synapses have not yet reached a low enough level to strongly deviate from criticality. (E) In contrast with the results in Fig 6, the transient period (blue) exhibits high discrimination as expected for critical dynamics. The subcritical steady state (solid, orange) exhibits decreased discrimination compared with the critical steady state of Fig 6 (open, orange). Box vertically spans the two quartiles around the median (middle line). Whiskers indicate the range of the data.

