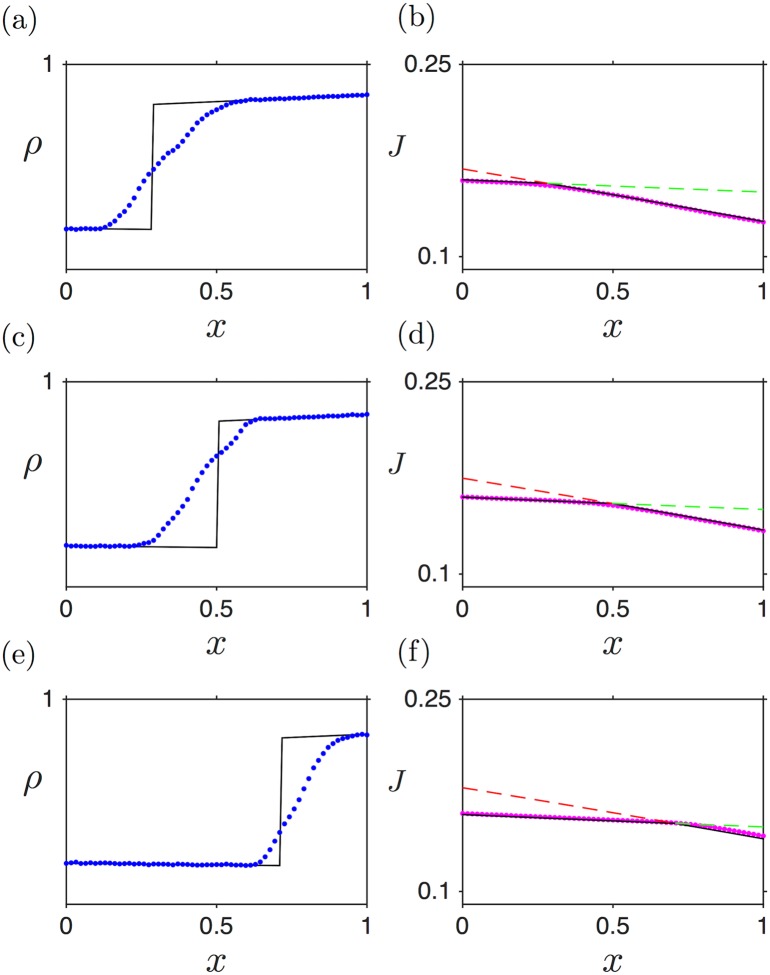
Fig 5. Density and current profiles in the shock phase, for , L = 1 and .
(a,b) , (c,d) and (e,f) . Numerical simulations are shown as blue (density) and magenta (current) points, whereas analytical predictions for the density profiles are shown as black lines. For the current profiles the analytical expressions for JLD(x) and JHD(x) are shown with green and red dashed lines, respectively.

