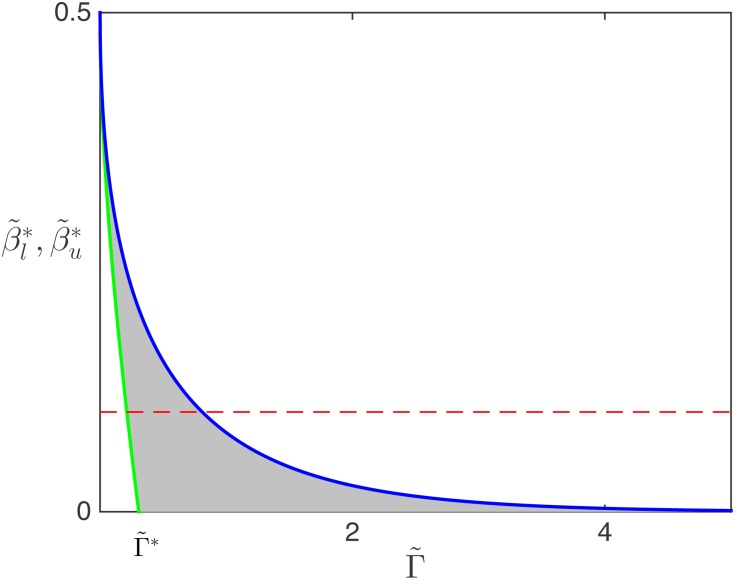
Fig 10. Analytically computed upper and lower boundaries to the MC-HD shock phase, depending on for L = 1.
The green line represents the lower boundary and the blue line corresponds to the upper boundary . The horizontal red dashed line serve as illustration. The intersections (at ) with and indicate the values of the drop-off rates at which an mRNA with termination rate would undergo a transition from HD to SP, and from SP to MC, respectively.

