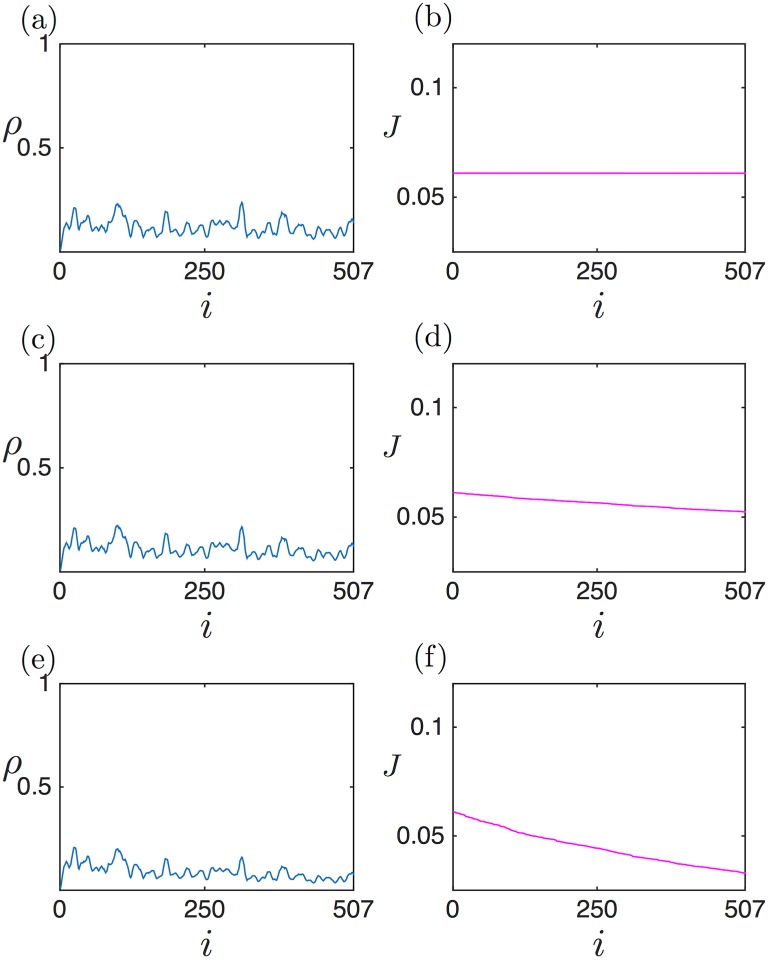
Fig 14. Density (a,c,e) and current (b,d,f) profiles for CDC7 (YDL017W), for α = 7 × 10⁻² s−1, in a low density-like phase.
In the density profiles we represent the coverage density of ribosomes, i.e., the probability for a codon to be covered by a ribosome. (a),(b): no ribosome drop-off γ = 0; (c), (d): physiological value of ribosome drop-off γ = 1.4 × 10⁻³ s−1; (e), (f): ribosome drop-off under ethanol stress γ = 5.6 × 10⁻³ s−1. The slope in the current profile clearly increases with the ribosome drop-off rate, and in the density profile the slight slope towards the 3’ is also reinforced by drop-off.

