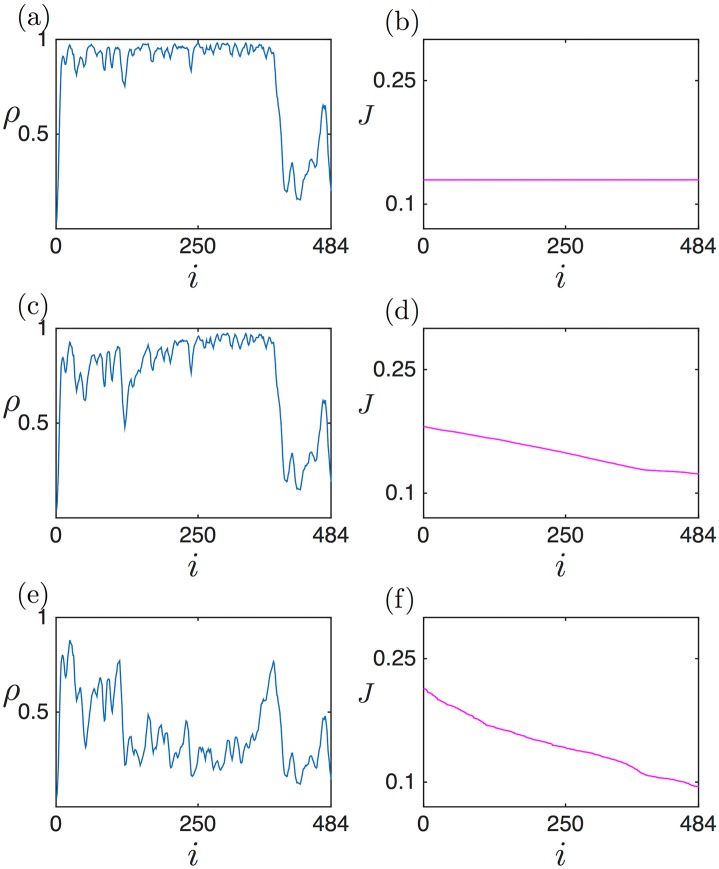
Fig 15. Density (a, c, e) and current (b, d, f) profiles for SLT2 (YHR030C), for α = 1s−1, a in high density-like phase.
Details, including the values of γ, are as in Fig 14. (a),(b): no ribosome drop-off γ = 0; (c), (d): physiological value of ribosome drop-off γ = 1.4 × 10⁻³ s−1; (e), (f): ribosome drop-off under ethanol stress γ = 5.6 × 10⁻³ s−1. The increasing slope in the 5’ to the 3’ direction characteristic of the HD phase is clearly visible in panel (c). Moreover, panel (d) illustrates the marked increase in the current at the 5’ end, compared to the case without ribosome drop-off (see panel (b)), also characteristic of the HD phase.

