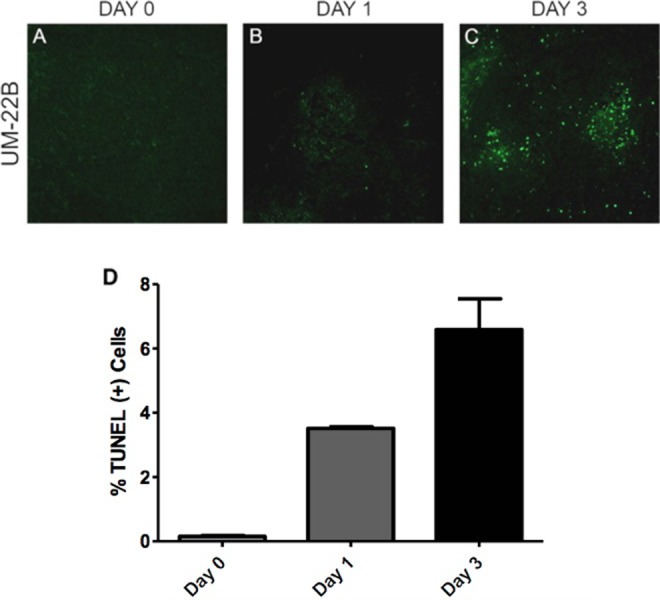
Figure 6.

Representative TUNEL-stained images of tumor specimen samples from different time points: (A) baseline, (B) 1 day after 1 dose of 10 mg/kg doxorubicin treatment, and (C) 3 days after a second dose of doxorubicin treatment in the UM-22B group. Apoptotic nuclei are shown in green. Normal cell nuclei are shown in blue, stained by DAPI. (D) TUNEL-positive cells counted and these counts were used to determine the percentage of apoptotic cells in the field. This was repeated for 3 fields of view for the 1- and 3-day groups, and on 2 fields for the day 0 group. DAPI indicates 4′,6-diamidino-2-phenylindole.
