Figure 5.
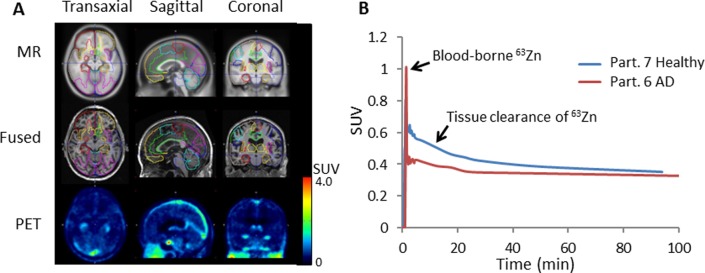
A, Regional image analysis of brain kinetics of 63Zn-zinc citrate. T1-weighted magnetic resonance (MR) images are shown at top and coregistered 63Zn-PET images at 45 to 50 minutes postinjection (PI) are shown at the bottom. Outlines of volumes of interest (VOIs) are shown in various colors on the MR and fused images. Low levels of zinc uptake (SUV < 0.5) were observed across brain. B, Representative left prefrontal cortex time–activity curves in patients with AD and healthy participants.

