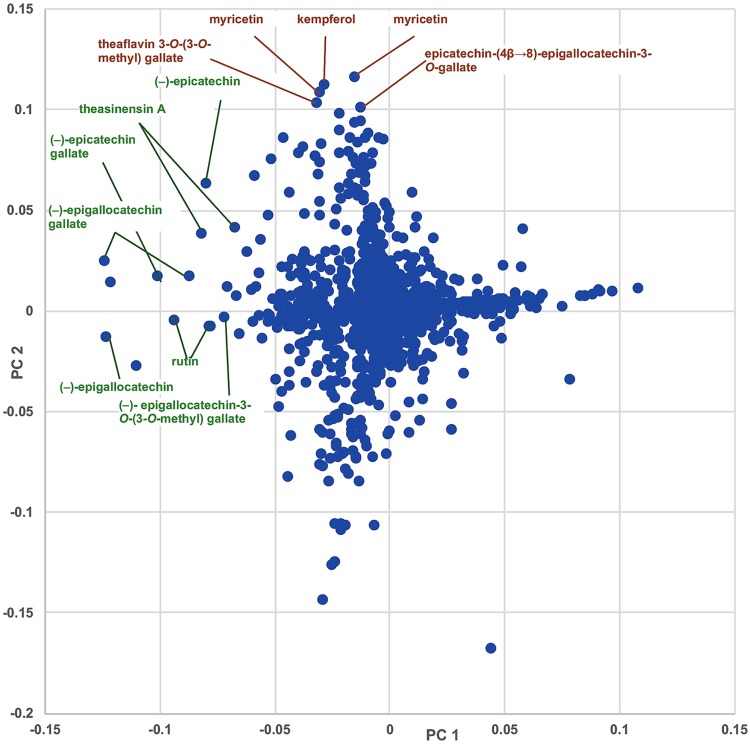
Figure 2.
Loadings plots from untargeted MS-based PCA of green tea samples. Metabolites with more negative correlation values along the x-axis (PC1, green labels) were present in higher concentrations in the green tea samples versus the negative control (T23, turmeric–ginger tea) and were responsible for the separation observed along the horizontal axis of Figure 1. Labeled metabolites with greater positive correlation along the y-axis (PC2, brown labels) were more heavily represented in green tea supplement samples versus the loose leaf green tea samples and were the dominant metabolites underlying the differentiation of the two sample groups in the vertical axis of Figure 1. Metabolites were identified by comparison against analytical standards. In cases where standards were not present, comparisons against the literature using m/z values from high-resolution mass spectrometry are provided. Identifications based on mass without reference standards are tentative.

