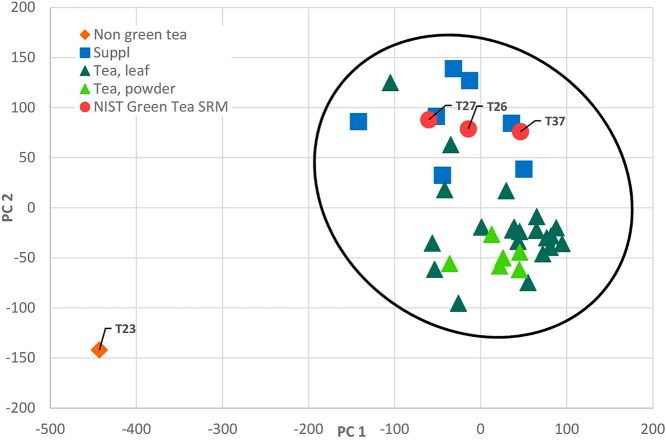
Figure 5.
Principal component analysis of targeted mass spectrometry data, drawn with Hotelling’s 95% confidence ellipse. The chemometric matrix consisted of 15 quantified samples (targeted variables) and 38 objects (for quantification data, see Table S3, Supporting Information). Representative samples are highlighted (T23, T26, T27, and T37).

