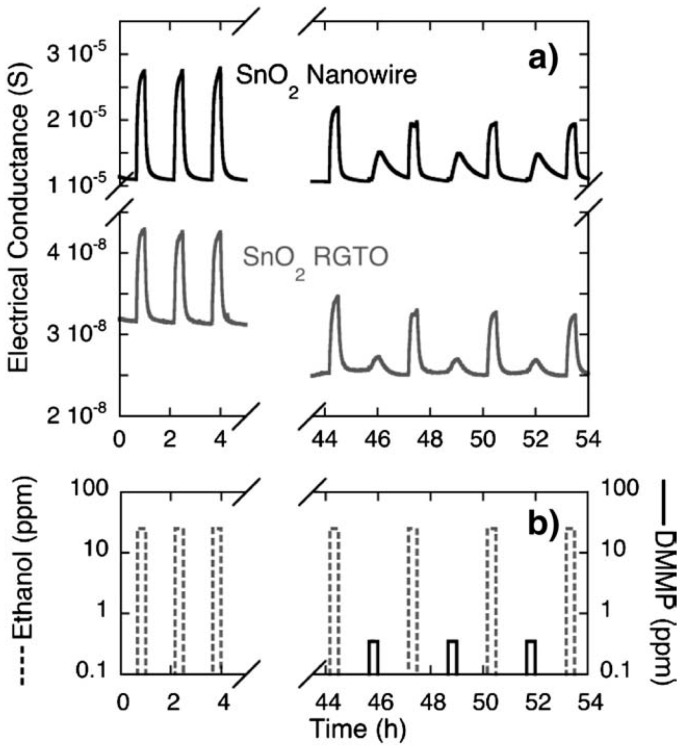
Figure 18.
(a) Dynamic response of SnO2 nanowires (black line) and RGTO (grey line) sensors to (b) different injections of ethanol (25 ppm) and DMMP (0.2 ppm). The comparison between the ethanol sequence and the ethanol-DMMP sequence evidences the poisoning effects due to DMMP exposure, also at weak concentrations. Reprinted from [41] with permission from Elsevier, copyright (2009).

