
Figure 3. Pathway crosstalk after drug treatment.
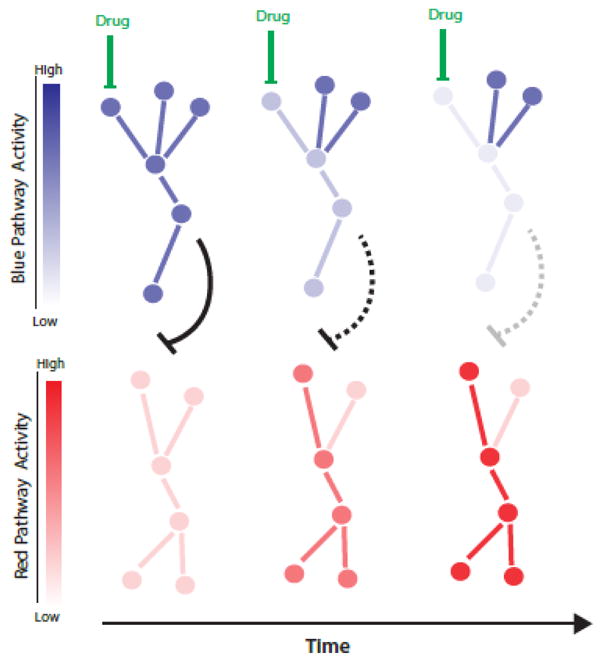
Drug administration leads to a gradual decrease in the drug-inhibited pathway (blue) followed by the activation of another signaling pathway (red) through their crosstalk reflected by the black inhibitory arrow.