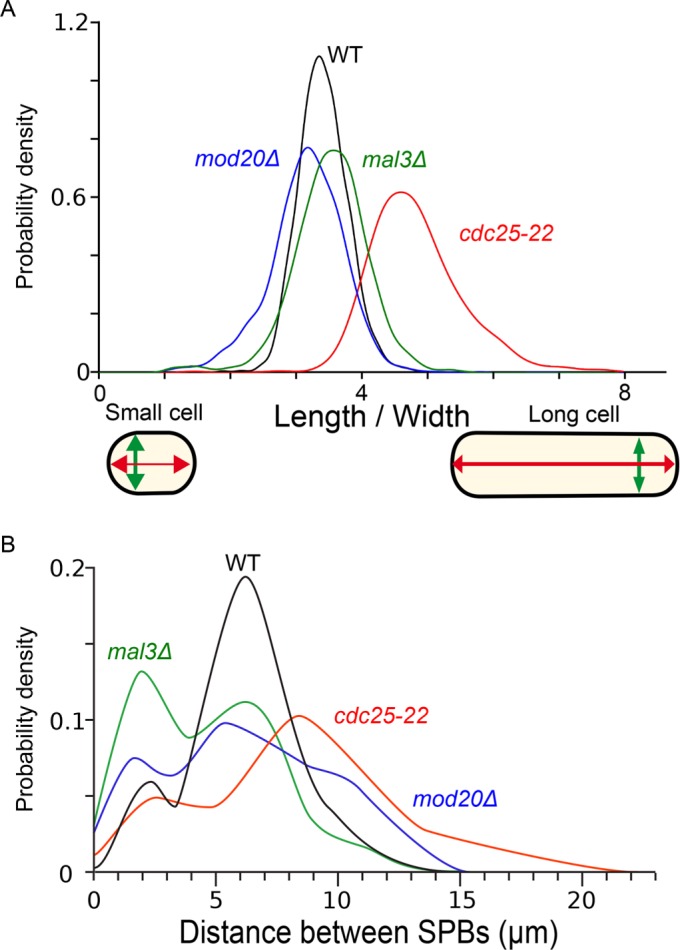
FIGURE 3:

Automated analysis of cell shape and pole-to-pole distance distribution in several genetic backgrounds. (A) Normalized density profiles of cell shape in wild-type (black), cdc25-22 (red), mal3∆ (green), and mod20∆ (blue) cells. (B) Normalized density profiles of distance between SPBs in wild-type (black), cdc25-22 (red), mal3∆ (green), and mod20∆ (blue) cells.
