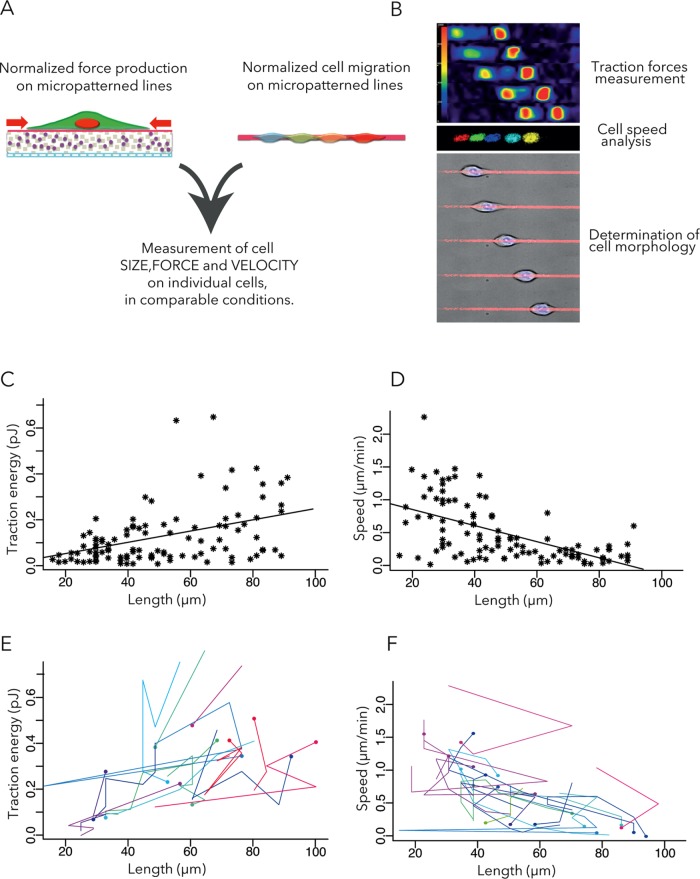
FIGURE 1:
Measurement of traction forces and migration speeds with respect to cell size. (A) Dynamic analyses of cell motion and traction forces exhibited by motile cells on micropatterned polyacrylamide hydrogels. (B) Examples of traction force field, nuclei displacements, and cell motion. (C) Contractile energy (measured by the energy required to deform the polyacrylamide hydrogel) vs. cell length. The line describes the linear regression. Pearson r = 0.39; 95% confidence interval (CI), 0.21–0.54. Seven independent experiments, 105 WT cells. (D) Cell speed vs. cell length. The line describes the linear regression. Pearson r = −0.57, 95% CI, −0.69 to −0.4. (E, F) Temporal variations of traction energy (E) and migration speed (F) with respect to cell length. Each color corresponds to a single cell. Dots correspond to initial time point and lines to temporal variations during the next 2 h. For clarity, only cells displaying traction energy variations > 0.2 pJ and cells displaying speed variations > 0.5 µm/min are shown.

