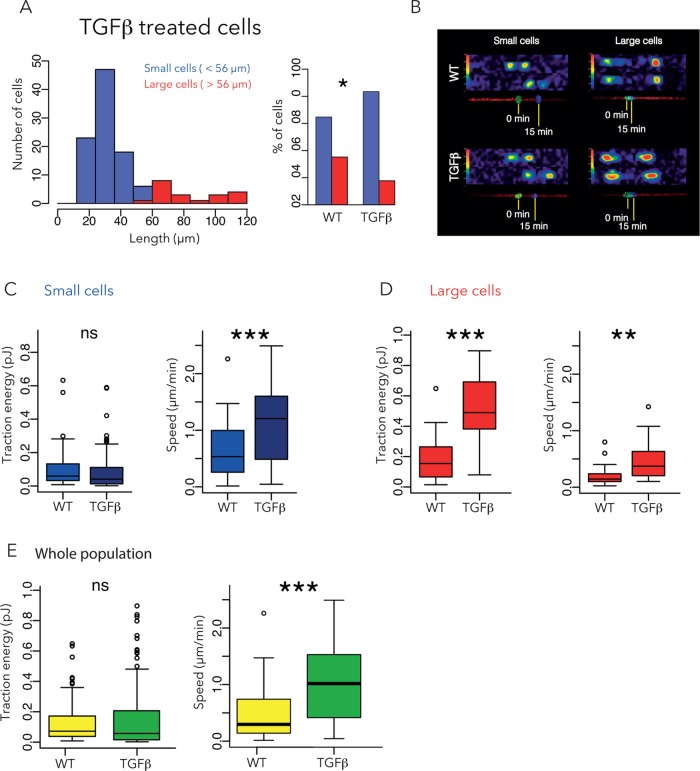
FIGURE 5:
Effect of TGF-β on cell size, traction force, and migration speed. (A) Size distribution of TGF-β-treated cells. Small cells are shown in blue, large cells in red. Five independent experiments, 114 cells. (B) Representative examples of traction force fields and corresponding nuclei displacements. (C, D) Contractile energy and migration speed of small (C) and large (D) TGFβ-treated cells compared with WT cells. (E) Contractile energy and speed of entire population, taking small and large cells together. Data for WT cells are reproduced from Figure 2.

