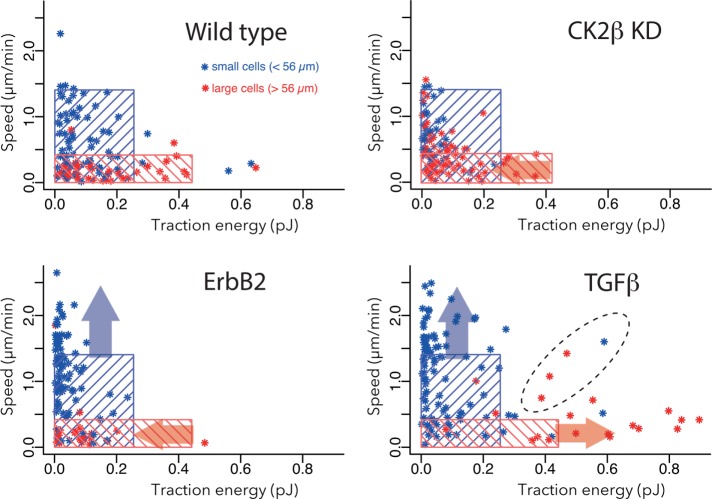
FIGURE 6:
Heterogeneity of single-cell response to tumorigenic factors. Cell speed vs. contractile energy. Top, left graph: the blue rectangle includes 95% of the small WT cells, and the red zone includes 95% of the large WT cells. These data are reproduced from Figure 2E. In the other three graphs, representing the data from ΔCK2β cells and TGF-β–treated cells, the same blue and red rectangles defined by the WT-cell groups are superimposed. Blue arrows represent the tendency to shift small-cell behavior in the speed–force profile even outside the limit defined by small WT cells. Red arrows represent the tendency to shift large-cell behavior in the speed–force profile even outside the limit defined by large WT cells. The dashed line surrounds cells with relatively high speeds and contractile forces, and which, in addition to being outside the limits defined by WT cells, do not respect the global trend negatively relating cell speed and contractile energy.

