FIGURE 4:
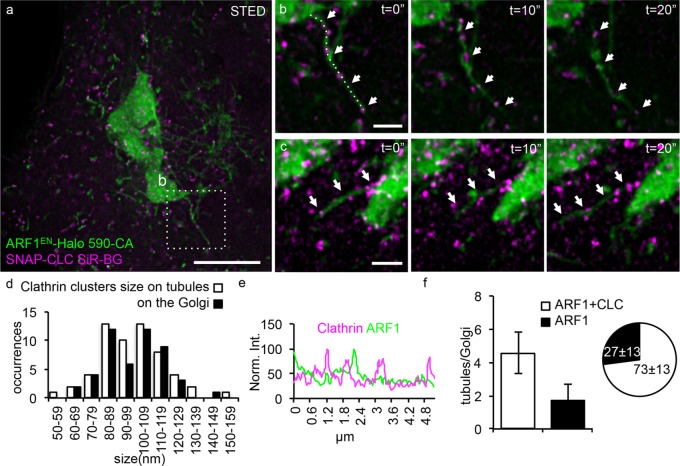
The majority of ARF1 tubules are decorated by clathrin clusters. ARF1EN-Halo (green) cells were electroporated with a plasmid encoding for SNAP-CLC (magenta). (a–c) Cells were labeled with 590-CA and SiR-BG for two-color live-cell STED imaging on a custom-built microscope. (b, c) Examples of Golgi-derived tubules are highlighted by arrows. (d) A two-dimensional Lorentzian function was fitted to images of clathrin clusters, and FWHM of the fitted functions is represented in histograms. The average size is 99 ± 18 nm for both clathrin clusters on the tubules and on the Golgi (50 clusters). (e) A line profile along the tubule in b shows that there is no enrichment of ARF1 in the clathrin clusters. (f) Quantification of the number of clathrin-positive tubules shows that 73 ± 13% of the tubules are decorated by SNAP-CLC clusters. All STED images were deconvolved; the line profile represents raw image data. Error bars represent SD. Scale bars, 5 μm (a), 1 μm (b, c).

