FIGURE 6:
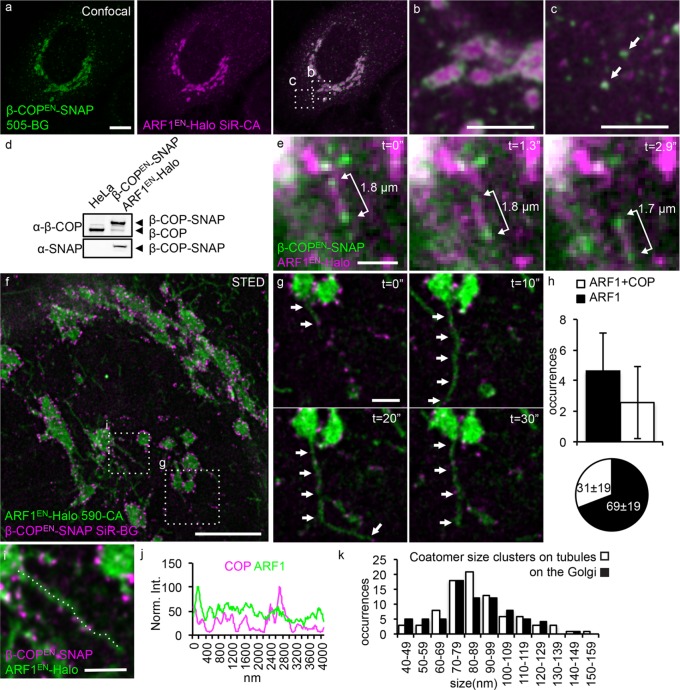
Coatomer clusters decorate the remaining fraction of ARF1EN-Halo tubules. (a–c) ARF1EN-Halo and β-COPEN-SNAP double-gene-edited cells were labeled with 505-BG (green) and SiR-CA (magenta) for confocal imaging. β-COPEN-SNAP localizes to (b) the rims of the Golgi cisternae and (c) peripheral ERGIC structures. (d) The correct tagging of endogenous β-COP was validated via Western blot. (e) ARF1EN-Halo and β-COPEN-SNAP cells were imaged with deep-TIRF at a frame rate of ∼3 frames/s on an OMX microscope. (e) Golgi-derived tubular structures labeled by ARF1EN-Halo and decorated by clusters of β-COPEN-SNAP were observed, and the distance between the clusters of coatomer remained constant. (f, g) The same double-gene-edited cells were labeled with 590-CA (green) and SiR-BG (magenta) for live-cell STED imaging on a custom instrument. (h) Single STED frames were used to quantify the number of coatomer-positive tubules/Golgi; 2.5 ± 2.3 tubules/Golgi were decorated by coatomer, which corresponds to 31 ± 19% of the total tubules. (i, j) Line profile along a coatomer-positive tubule shows that there is no enrichment of ARF1EN-Halo in the β-COPEN-SNAP–positive clusters. (k) A two-dimensional Lorentzian function was fitted to images of coatomer clusters, and FWHM of the fitted functions is represented in histograms. The average size of coatomer clusters on the tubules is 89 ± 24 nm, similar to the size of clusters/buds at the Golgi (86 ± 24 nm). All STED images were deconvolved; the line profile represents raw image data. Error bars represent SD. Scale bars, 10 μm (a), 5 μm (b, c), 2 μm (e), 5 μm (f), 1 μm (g, i).

