FIGURE 2:
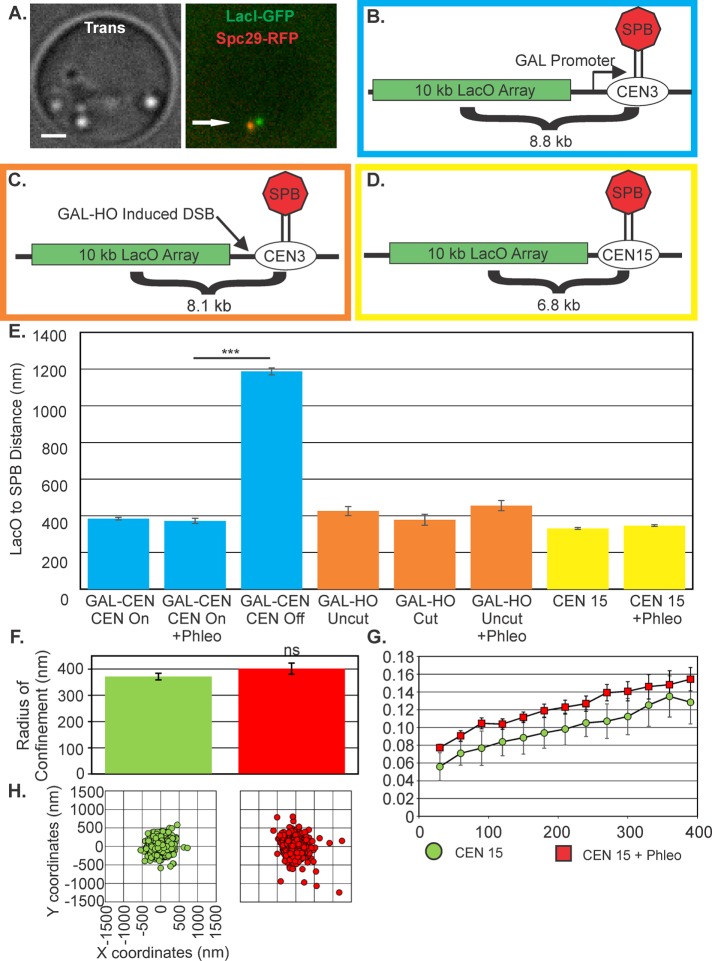
Centromeres are not released after DNA damage. (A) Image of centromere-proximal LacO cells in G1. Bar, 1 µm. Arrow points to SPB. (B) Schematic of LacO array 8.8 kb from galactose promoter–regulated CEN3(SGD10.2) (blue border). (C) Schematic of the HOcut-CEN3 chromosome. The chromosome contains an HO cut site adjacent to CEN3 on chromosome III (KBY8227; orange border). (D) Schematic of LacO array at 6.8 kb from CENXV (KBY8065; yellow border). (E) The average SPB to CEN-linked LacO distance in G1. Average distances were calculated from either time-lapse images at 30 s for 10 min or from single-cell populations. For GALCEN3 strain: glucose grown, 1008 cells; plus phleomycin, 154 cells; galactose grown, 609 cells. Inactivation of CEN3 on galactose (CEN Off) was significantly different from CEN3 on glucose (Student’s t test, p = 8 × 10−149). HOcut-CEN3: on glucose, 59 cells; on glucose plus phleomycin, 115 cells; and on galactose, 41 cells. CENXV untreated, 844 cells; and plus phleomycin, 1113 cells. Radius of confinement (F), MSD displacement curves (G), and scatterplots (H) of CENXV-linked lacO/LacI-GFP in untreated and phleomycin-treated cells. ns, not significantly different (Student’s t test, p = 0.2). Error bars are SEM.

