FIGURE 5:
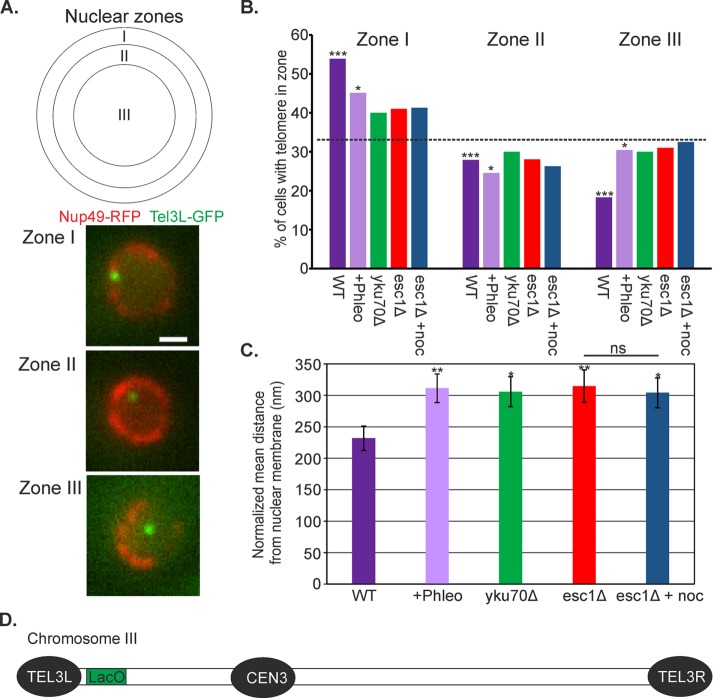
DNA damage alters telomere positioning in a way quantitatively similar to esc1Δ and yku70Δ. (A) The nucleus in 2D image stacks was partitioned into three zones of equal area. Nuclear envelope is labeled in red (Nup49-RFP) and TEL3L in green (LacO/LacI-GFP). Bar, 1 μm. (B) Distribution of LacO at TEL3L relative to the nuclear envelope in G1/S cells. The p values for the χ2 test were calculated for each data set compared with a random distribution (33% for each zone; dashed line: WT (p = 2 × 10⁻⁶, n = 104), plus phleomycin (p = 0.03, n = 102), yku70Δ (p = 0.4, n = 100), esc1Δ (p = 0.3, n = 100), and esc1Δ plus nocodazole (p = 0.4, n = 81). (C) Bar chart of the mean normalized distance of TEL3L array from the nuclear membrane. Distances were normalized to the radius of the nucleus. Error bars are SEM. Data are the same as in B. Asterisks indicate a significant difference from WT (Student’s t test; plus phleomycin, p = 0.009; yku70Δ, p = 0.02; esc1Δ, p = 0.01; esc1Δ plus nocodazole, p = 0.02). ns, not significantly different (Student’s t test, p = 0.8). (D) Schematic of the position of TEL3L-proximal LacO on chromosome III.

