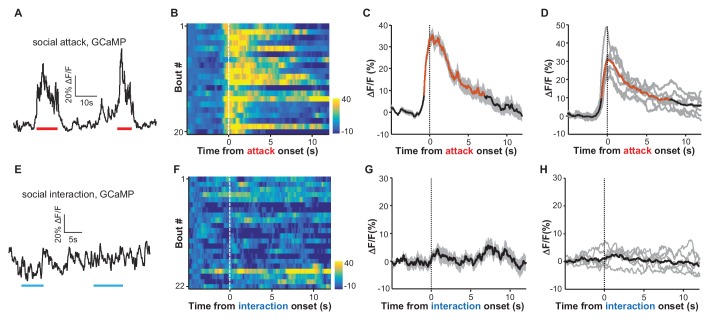
Figure 2. Social attack by an aggressor activates LHb neurons.
(A–D) Ca2+ signals in the LHb neurons of test male mice increased when an aggressive resident male attacked the test male. A Vglut2-LHb-GCaMP6 male mouse was introduced into the home cage of a CD-1 male mouse (aggressor), who often initiated attacks on the test male. GCaMP fluorescence changes were segmented and aligned to the onset of attack by the resident male. (A) Raw trace of GCaMP6m fluorescence levels in response to social defeat. (B) Heatmap representation of Ca2+ transients in the LHb neurons of a Vglut2-LHb-GCaMP6 mouse. Each row represents a bout. (C) Peri-event plot of the average Ca2+ transients from the same mouse shown in (B). (D) Mean Ca2+ signals for the entire test group (n = 7 Vglut2-LHb-GCaMP6 mice). In (C and D), thick lines indicate the mean and shaded areas indicate the SEM. Red segments indicate statistically-significant increases from the baseline (p<0.05; multivariate permutation test). (E–H) Raw trace (E), heatmap (F), and average Ca2+ transient of an individual mouse (G), as well as the average plot for the entire test group (H), all showing the lack of clear Ca2+ signals during the social interaction between the test male and its non-aggressive male littermate (n = 6 Vglut2-LHb-GCaMP6 mice). Same conventions as in (A–D).


