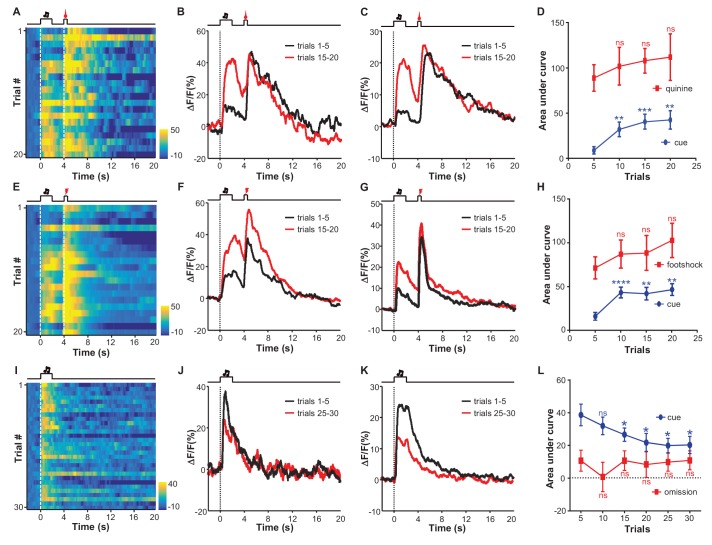
Figure 3. Aversive conditioning rapidly induces excitatory responses to aversion-predicting cues and omitting an unconditioned aversive stimulus slowly extinguishes previously-conditioned responses.
(A) Heatmap representation of LHb Ca2+ transients within a session of cue-quinine Pavlovian conditioning. The conditioning session consisted of 20 trials. The dashed lines and timeline below indicate the timing of an auditory cue (2 s), delay (2 s), and intra-oral infusion of quinine (0.5 s). (B) The peri-event plot of the average Ca2+ transient from the same mouse shown in (A) during the first five trials (black) and last 5 trials of the conditioning session. (C) Mean Ca2+ transient for the entire test group (n = 9 mice). (D) Sum of Ca2+ transients for cues (0–2 s; blue line) and quinine infusion (4.0–4.5 s; red line) throughout the conditioning process. (E–H) LHb neurons rapidly gained responses to an auditory cue after its coupling to footshock. (E) Heatmap representation of Ca2+ transients during a conditioning session (n = 20 trials). (F) Mean Ca2+ transients across the conditioning trials for the same mouse shown in (E). (G) Mean Ca2+ transients for the entire test group (n = 9 mice). (H) Ca2+ responses to the auditory cue (0–2 s, blue line) increase, whereas those to the footshock (4.0–4.5 s, red line) remain largely stable during the conditioning phase (n = 9 mice). (I–L) The effects of omitting footshock on previously conditioned responses to the footshock-predicting cue. (I) Heatmap representation of Ca2+ transients in an extinction session (30 trials), within which we repetitively presented 30 CS cues but omitted footshock. (J) Mean Ca2+ transients for one extinction session. (I and J) correspond to the same mouse in (E and F). (K) Population mean of Ca2+ transients (n = 9 mice). Thick lines indicate the mean and shaded areas indicate the SEM. Red segments indicate statistically-significant increases from the baseline (p<0.05; multivariate permutation test). (L) Sum of Ca2+ transients during cue presentation (0–2 s; blue line) and footshock omission (4–4.5 s; red line). Each data point represents the average of 5 consecutive trials. (In D, H, L), *p<0.05; **p<0.01; ***p<0.001; ****p<0.0001; n.s., not significant; nonparametric one-way ANOVA with Geisser-Greenhouse correction for the difference between the first data point and those of the following trials.


