Figure 4. Social defeat by CD-1 aggressors induces excitatory responses of LHb neurons that were previously nonresponsive to aggressors.
(A) Behavioral experimental paradigm. The upper panel shows the timeline of the experiments. During the first and last days (day 1 and day 12), we recorded Ca2+ signals of LHb neurons from a test mouse interacting with a CD-1 aggressor separated by a mesh enclosure in the social interaction arena (lower panel). During days 2-11, the test mouse was challenged with social defeat by an aggressive CD-1 mouse in the resident CD1 aggressor’s home-cage. (B–D) Heatmap representation (B) and averaged Ca2+ signals (C) from one test mouse and the group data (D, n = 6 mice) show that investigation of the aggressor by the test mouse did not produce any clear activation of LHb neurons. We defined an 'investigation' event as when the test mouse entered the interaction zone near the aggressor. (E–G) Following repeated social defeat over 10 days, a naive aggressor induced clear activation of LHb neurons in the test mouse. (E) A heatmap illustrating the response of eight consecutive investigation events of one test mouse in a behavioral session. (F) Average responses of the same mouse shown in (E). (G) Group data (n = 6 mice). In (C and F), thick lines indicate the mean and shaded areas indicate the SEM. In (D and G), each gray line represents data from an individual test mouse. Red segments indicate statistically-significant increases from the baseline (p<0.05; multivariate permutation test).

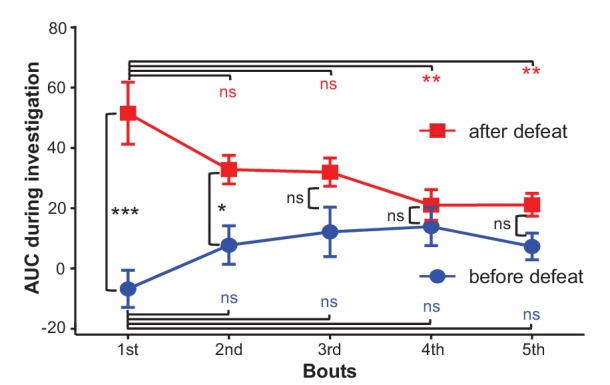
Figure 4—figure supplement 1. The effects of social defeat and investigation trials on investigation-associated Ca2+ signals of LHb neurons.