
Author response image 2. There is not clear relationship between the cue-evoked Ca2+ signals and animal locomotor speed.
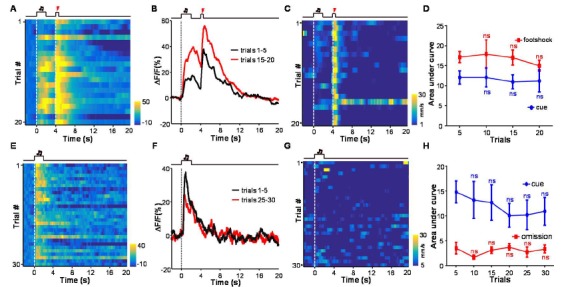
(A) Heatmap representation of Ca2+ transients during a conditioning session (n =20 trials; the same one shown in Figure 3E). (B) The peri-event plot of the average Ca2+ transient from the same mouse shown in (A) during the first 5 trials (black) and last 5 trials of the conditioning session. (C) Heatmap represents the locomotion speed of the same mouse shown in (A) during a conditioning session. (D) Walking distance during cue presentation (0-2 s; blue line) and footshock delivery (4-4.5 s; red line). Each data point represents the average of 5 consecutive trials. (E-H) The effects of omitting footshock on previously conditioned responses to the footshock-predicting cue and locomotion speed. (E) Heatmap representation of Ca2+ transients in an extinction session (30 trials), within which we repetitively presented 30 CS cues but omitted footshock. (F) Mean Ca2+ transients in one extinction session. (E and F) correspond to the same mouse in (A and B). (G) Heatmap represents the locomotor speed of the same mouse shown in (A) in an extinction session. (H) Walking distance during cue presentation (0-2 s; blue line) and footshock omission (4-4.5 s; red line). Each data point represents the average of 5 consecutive trials. The distance was measured as the accumulating pixel changes in video frames during either CS or US presentation. (In D, H) n.s., not significant; nonparametric one-way ANOVA for the difference between the first data point and those of the following trials.