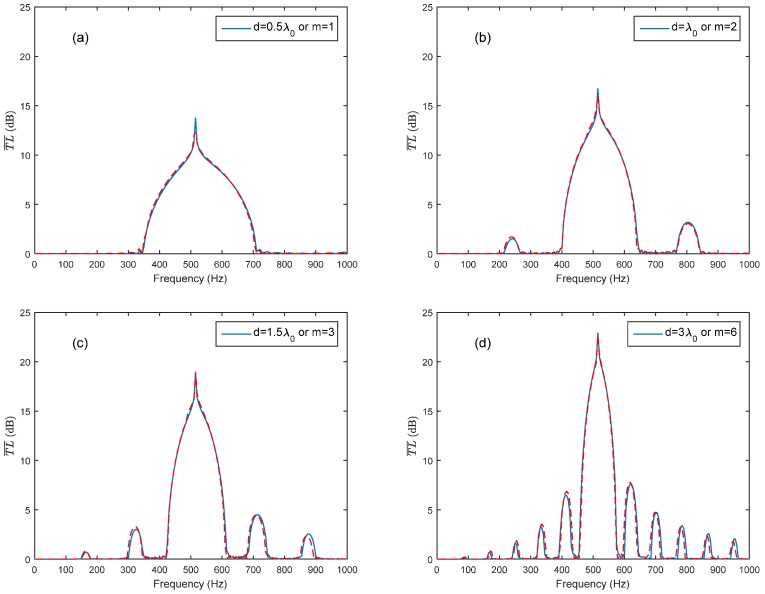
Figure 6.
Comparison of theoretical predictions and the FEM simulation in respect of different periodic distances (solid lines represent the theoretical predictions, and dashed lines represent the FEM simulation results): (a) periodic distance ; (b) periodic distance ; (c) periodic distance ; (d) periodic distance .

