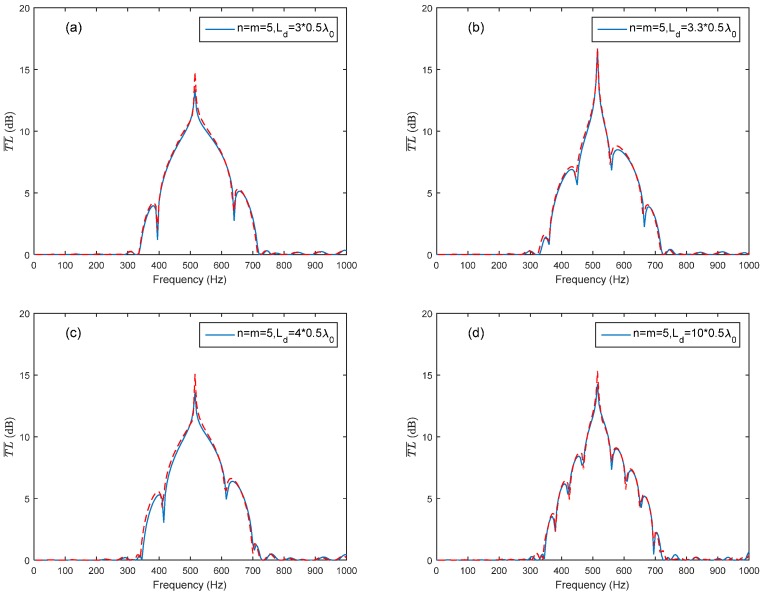
Figure 8.
Comparison of theoretical predictions and the FEM simulation with respect to different connection tube lengths Ld between the two periodic parts (solid lines represent the theoretical predictions, and dashed lines represent the FEM simulation results): (a) n = m = 5, ; (b) n = m = 5, ; (c) n = m = 5, ; (d) n = m = 5, .

