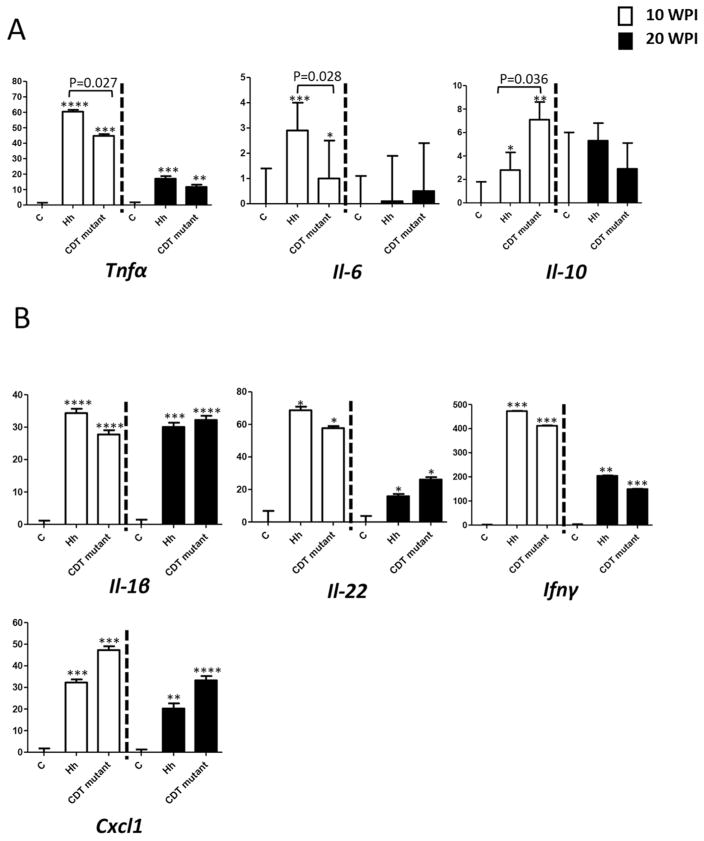
Figure 5.
Relative mRNA levels of select cecal genes contributing to inflammation and carcinogenesis. The significant transcriptional differences were found for some genes (A) and not for the others (B) between Hh- and the HhCDT-infected mice. For the comparison of mRNA, the target mRNA was normalized to that of the “house-keeping: gene Gapdh. Numbers on the y axis represent mean fold change of the individual mRNA levels in reference to the control group (defined as 0). Bars, standard deviations. * represents P values when compared to the sham controls: * <0.05, **<0.01, ***<0.001.

