
Figure 4.
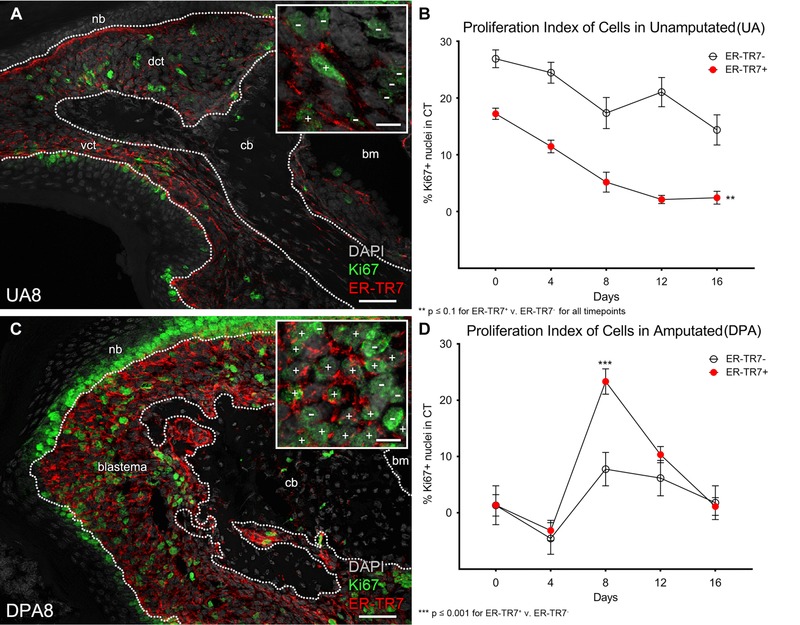
Expansion of ER‐TR7+ FRCs is specific to the blastema stage. A total of 500 cells were counted from random fields subsampled from the dorsal and ventral CT (dct and vct) or the blastema of neonatal controls and regenerates, respectively. The P3 bone marrow (bm) was excluded. In representative (A) UA8 and (C) DPA8 samples, these areas are flanked by the nail bed (nb) and the P3 bone (b) and outlined with a dotted white line (scale bar 50 μm). Proliferating (Ki67+) cells were grouped by ER‐TR7+ or ER‐TR7− expression. (A), (C), insets: ER‐TR7+/Ki67+ cells were discriminated at 1000× magnification and are labeled with white + signs. ER‐TR7−/Ki67+ cells are marked with a − sign (scale bar 10 μm). (B) Measurement of the ratio of proliferating ER‐TR7− cells to ER‐TR7+ cells in UA controls. (D) DPA8 blastema proliferating cells relative to ER‐TR7 reactivity. Data are presented as the mean ± SE (n = 4 per group)