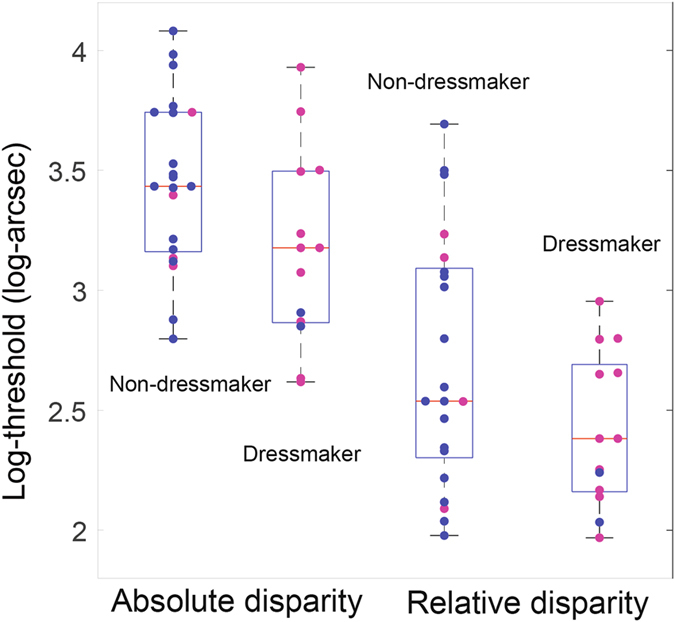
Figure 2.

Boxplots of log-transformed thresholds for discrimination of depth from absolute disparities only (left side) and from additional relative disparities (right side), for non-dressmaker and dressmaker groups. The median for each group is in red and the blue box defines the Q1 and Q3 quantiles for each group. The whiskers encompass the entire distribution. Each pink dot is a data point for a female participant and each blue dot is a data point for a male participant.
