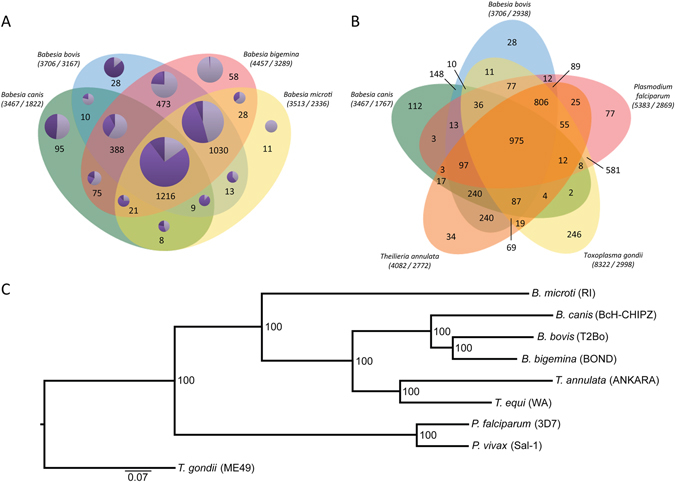
Figure 2.

Comparative analyses of the Babesia canis BcH-CHIPZ genome. (A) Comparison of orthologous clusters in four Babesia species and (B) representative Apicomplexa species. The number of orthologous groups is indicated in the intersections. The total number of gene-models and clusters for each species is shown in brackets. Orthologous gene clusters in (A) are divided into three categories (pie chart colour code:  multigene families;
  genes with annotations;
  hypothetical genes). (C) Maximum likelihood phylogeny showing evolutionary relationship between selected Babesia, Theileria and Plasmodium species based on 975 shared orthologues in Apicomplexan species. The scale is in substitutions per site.
