
Figure 6.
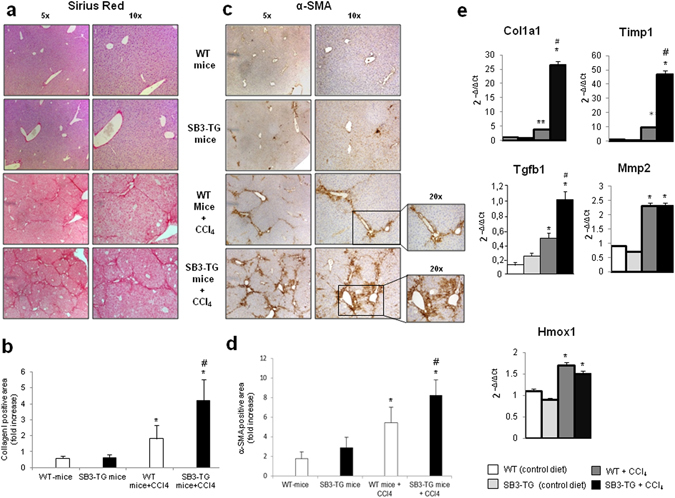
Liver fibrosis “in vivo” in SerpinB3 transgenic (TG) mice vs wild type (WT) mice exposed to chronic CCl4 administration. (a,c) Following chronic exposure to CCl4 (10 weeks) liver fibrosis was morphologically evaluated by Sirius red staining (a) or by immunohistochemistry for α-SMA (c). Original magnification as indicated. (b,d) ImageJ software analysis was performed for both Sirius red staining (b) and α-SMA immunohistochemistry analysis (d) to evaluate the amount of fibrosis. (e) Analysis by quantitative real-time PCR (Q-PCR) of SerpinB3 transcript levels of pro-fibrogenic genes in the different experimental groups. Data in graphs are expressed as means ± SEM (n = 6 mice for any experimental group) (*p < 0.05 vs relative control mice; #p < 0.05 vs WT-mice treated with CCl4).