
Figure 4.
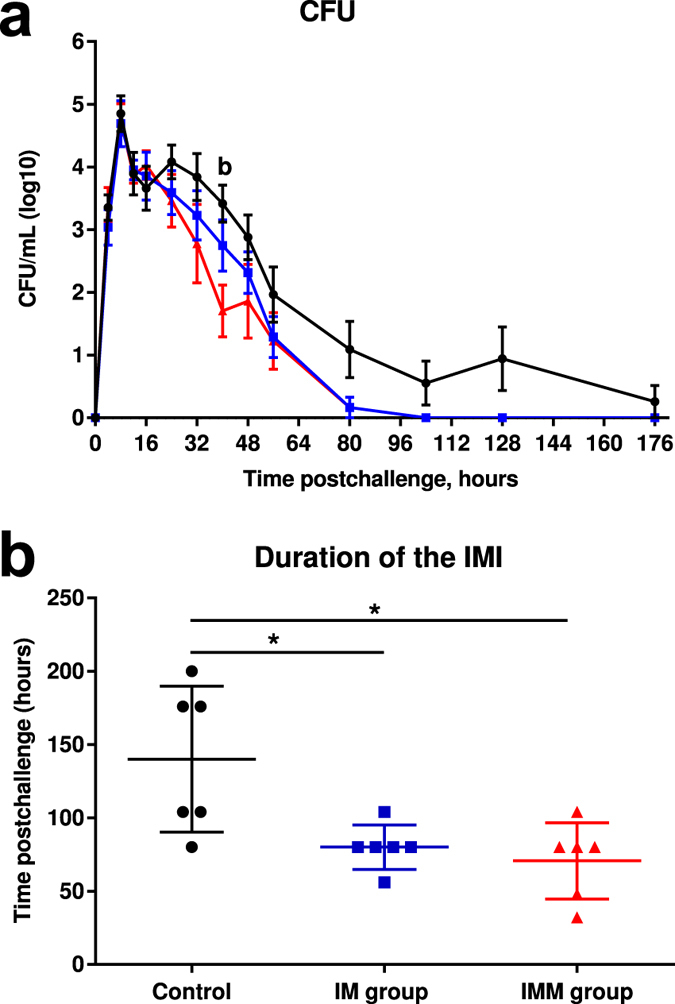
Infection monitoring. Colony forming units per mL of milk expressed as log10 (a) upon intramammary challenge with E. coli P4 at 0 h and duration of the intramammary infection (b) upon intramammary challenge in first-lactation heifers from the three treatment groups: adjuvant only (black circles) intramuscular injections (blue squares) intramuscular and intramammary injections (red triangles). Means and error bars, corresponding to standard errors of the mean for each treatment group at each sample point (a) or to standard deviation (b), are presented. Letters (a,b,c) within hours indicate a difference (P < 0.05, Two-way ANOVA and/or Mann Whitney test) between control and IM groups, control and IMM groups, and IM and IMM groups respectively. Asterisk indicate a difference (P < 0.05, Two-way ANOVA and/or Mann Whitney test) between immunization groups.