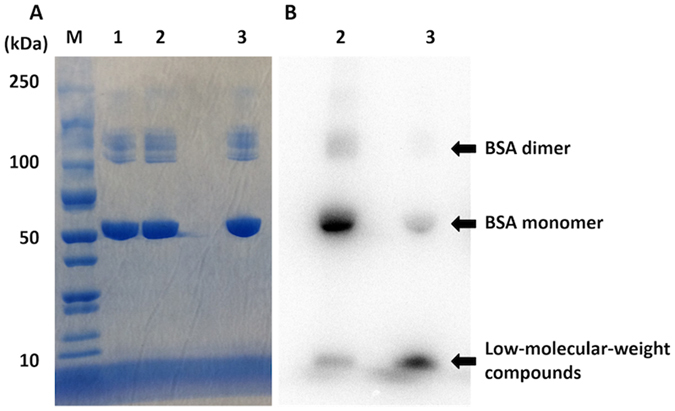
Figure 10.

Analysis of [125I]4-BSA by SDS-PAGE. Left and right panels show CBB staining (A) and autoradiography (B), respectively. BSA (8 ng) only (lane 1, CBB staining), [125I]4-BSA (8 ng) (lane 2, CBB staining and autoradiography), and the reaction mixture of [125I]2 and BSA (8 ng) (lane 3, CBB staining and autoradiography) were subjected to SDS-PAGE, respectively. Lane M shows molecular weight markers. Images were cropped to remove extraneous areas.
